


One of the most common questions around saving for retirement is: Am I on track?
While it’s a good question to ask, there are a lot of factors that influence the answer. Between your future spending, your age, your family situation, and your financial goals, knowing whether you’re saving enough is harder than it looks.
But what if there was a better way? What if we could find a good enough answer rather than trying to chase the perfect one? What if we relied on data instead of guesswork?
That’s what this post is about. There have been a lot of articles on how much you should have saved for retirement by age. But I haven’t seen one that does a deep dive on how much Americans actually have saved for retirement and what this means for your retirement savings.
So let’s get started.
What the Traditional Retirement Savings Advice Says
The traditional retirement savings advice says that you should have a certain amount saved for retirement by a given age. For example, Fidelity argued that you should have a certain multiple of your salary saved based on your age:
- Age 30 = 1x
- Age 35 = 2x
- Age 40 = 3x
- Age 45 = 4x
- Age 50 = 6x
- Age 55 = 7x
- Age 60 = 8x
- Age 67 = 10x
So if you were 30 and making $100k/year, you would need to have $100k [1x income] in retirement savings. If you were 45 and making $100k/year, you would need $400k [4x income] in retirement savings. And so forth.
Below is a chart showing how much you would need to have saved by age for a $50k, $100k, and $200k income using the benchmark above:
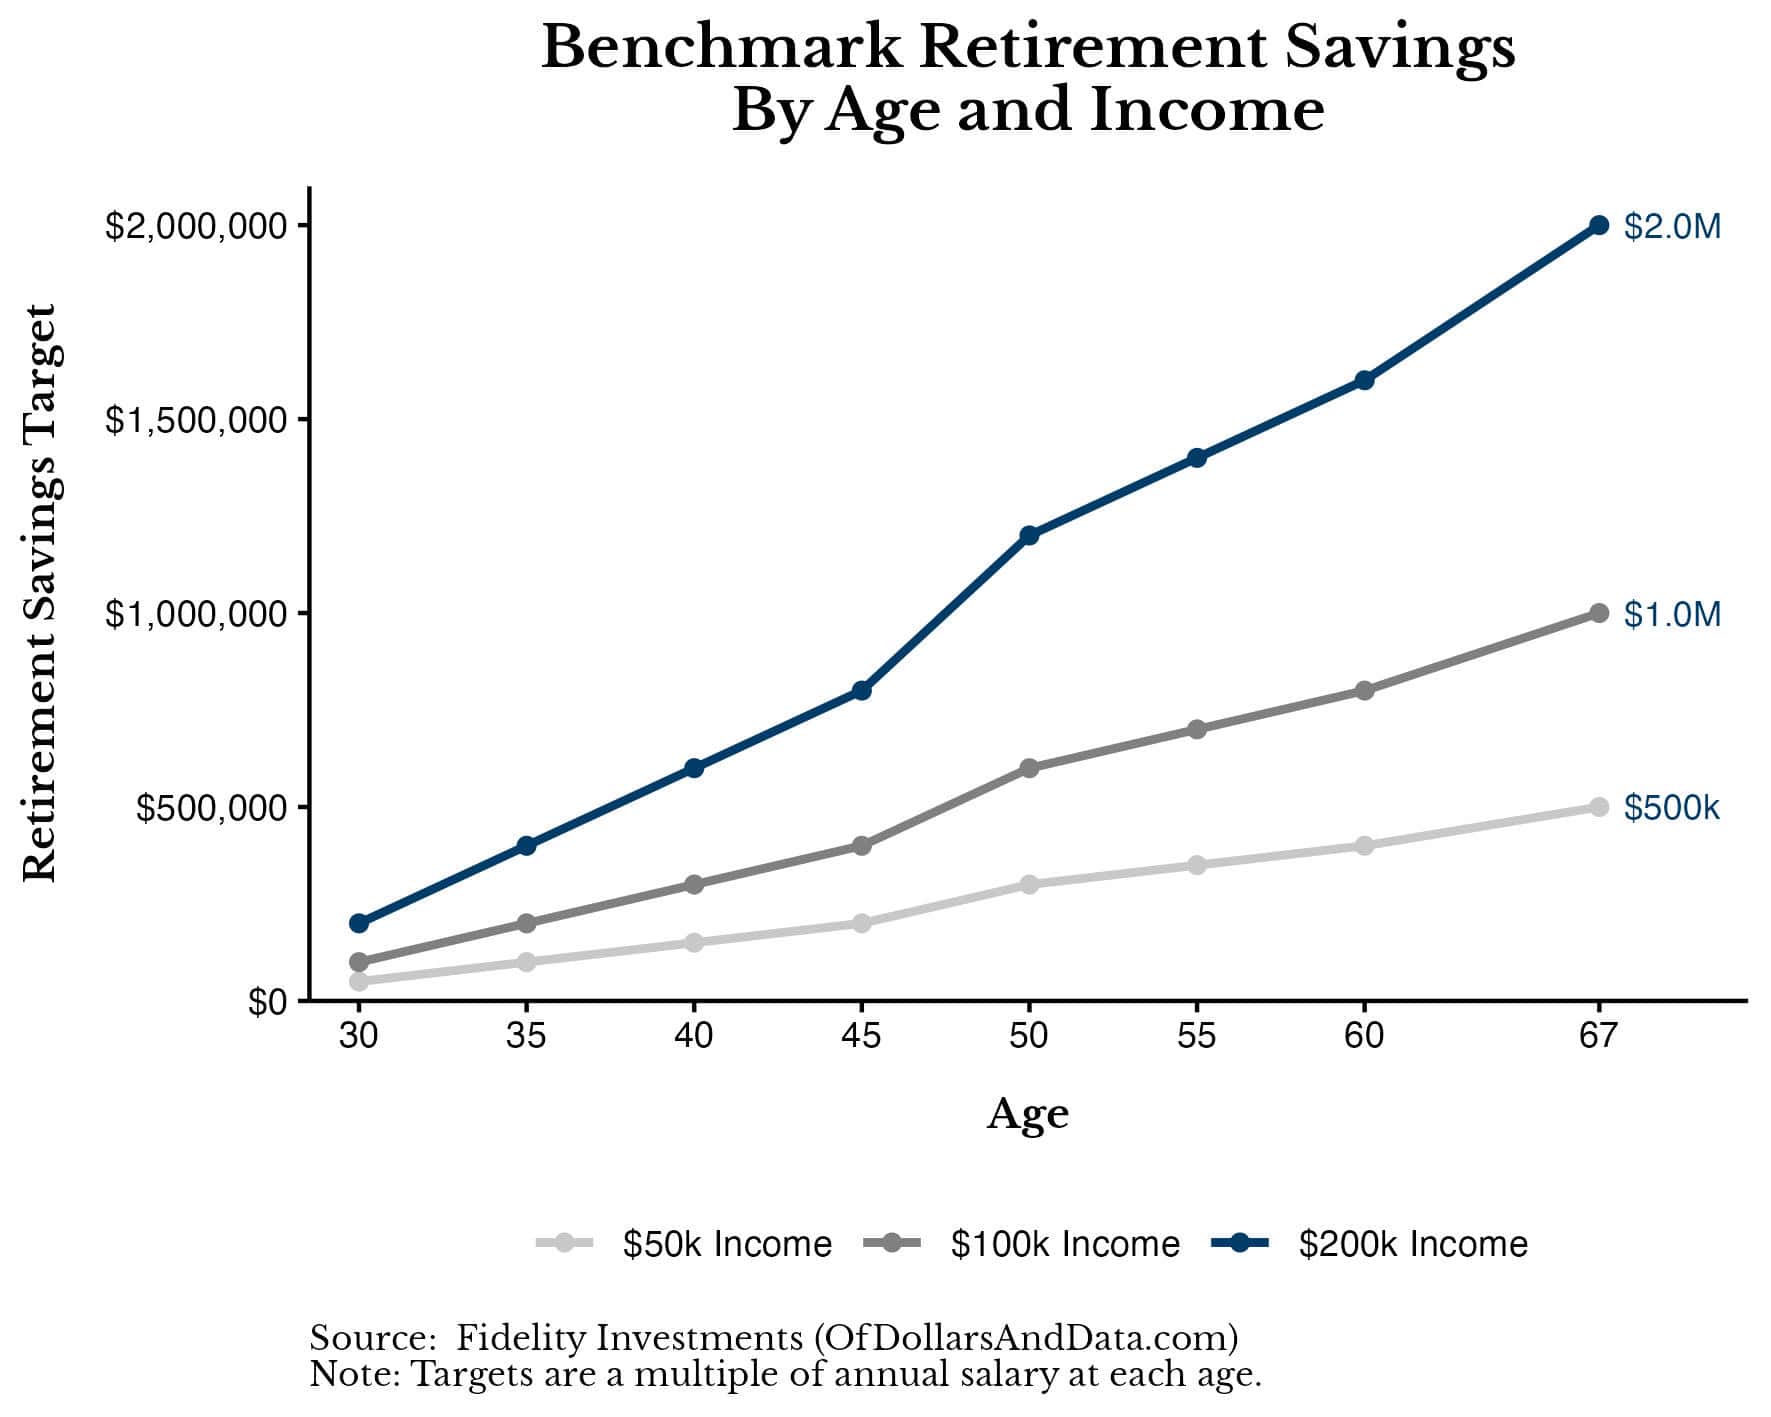
This isn’t a bad rule to follow, but it isn’t a great one either. One of the problems with income-based savings guidelines is that income can be quite volatile.
For example, if your income doubles within a decade, should we also double what you need to save for retirement?
What if you work a commission-based role and have a killer year? Do we use that year of income to determine how much you need to save for retirement, or do we use an average of your income?
What if you have a high-paying job, but then get laid off? If you take a new role that is much lower paying, do we revise your retirement needs downward to reflect your new (lower) income?
I understand that these are rough guidelines, but they can be hard to follow if your income is even slightly unstable.
But the other big problem with income-based savings guidelines is that most U.S. households aren’t meeting them. Let’s look at how much Americans actually have saved for retirement to see why.
How Much Do Americans Actually Have Saved for Retirement?
Unfortunately, the data on retirement savings in America isn’t great. The median retirement account balance among all U.S. households is just $5k (from the 2025 SCF data). There are two reasons for this.
First, there’s a large variation in retirement savings by age cohort. For example, the youngest households and the oldest households tend to have less retirement savings than everyone else:
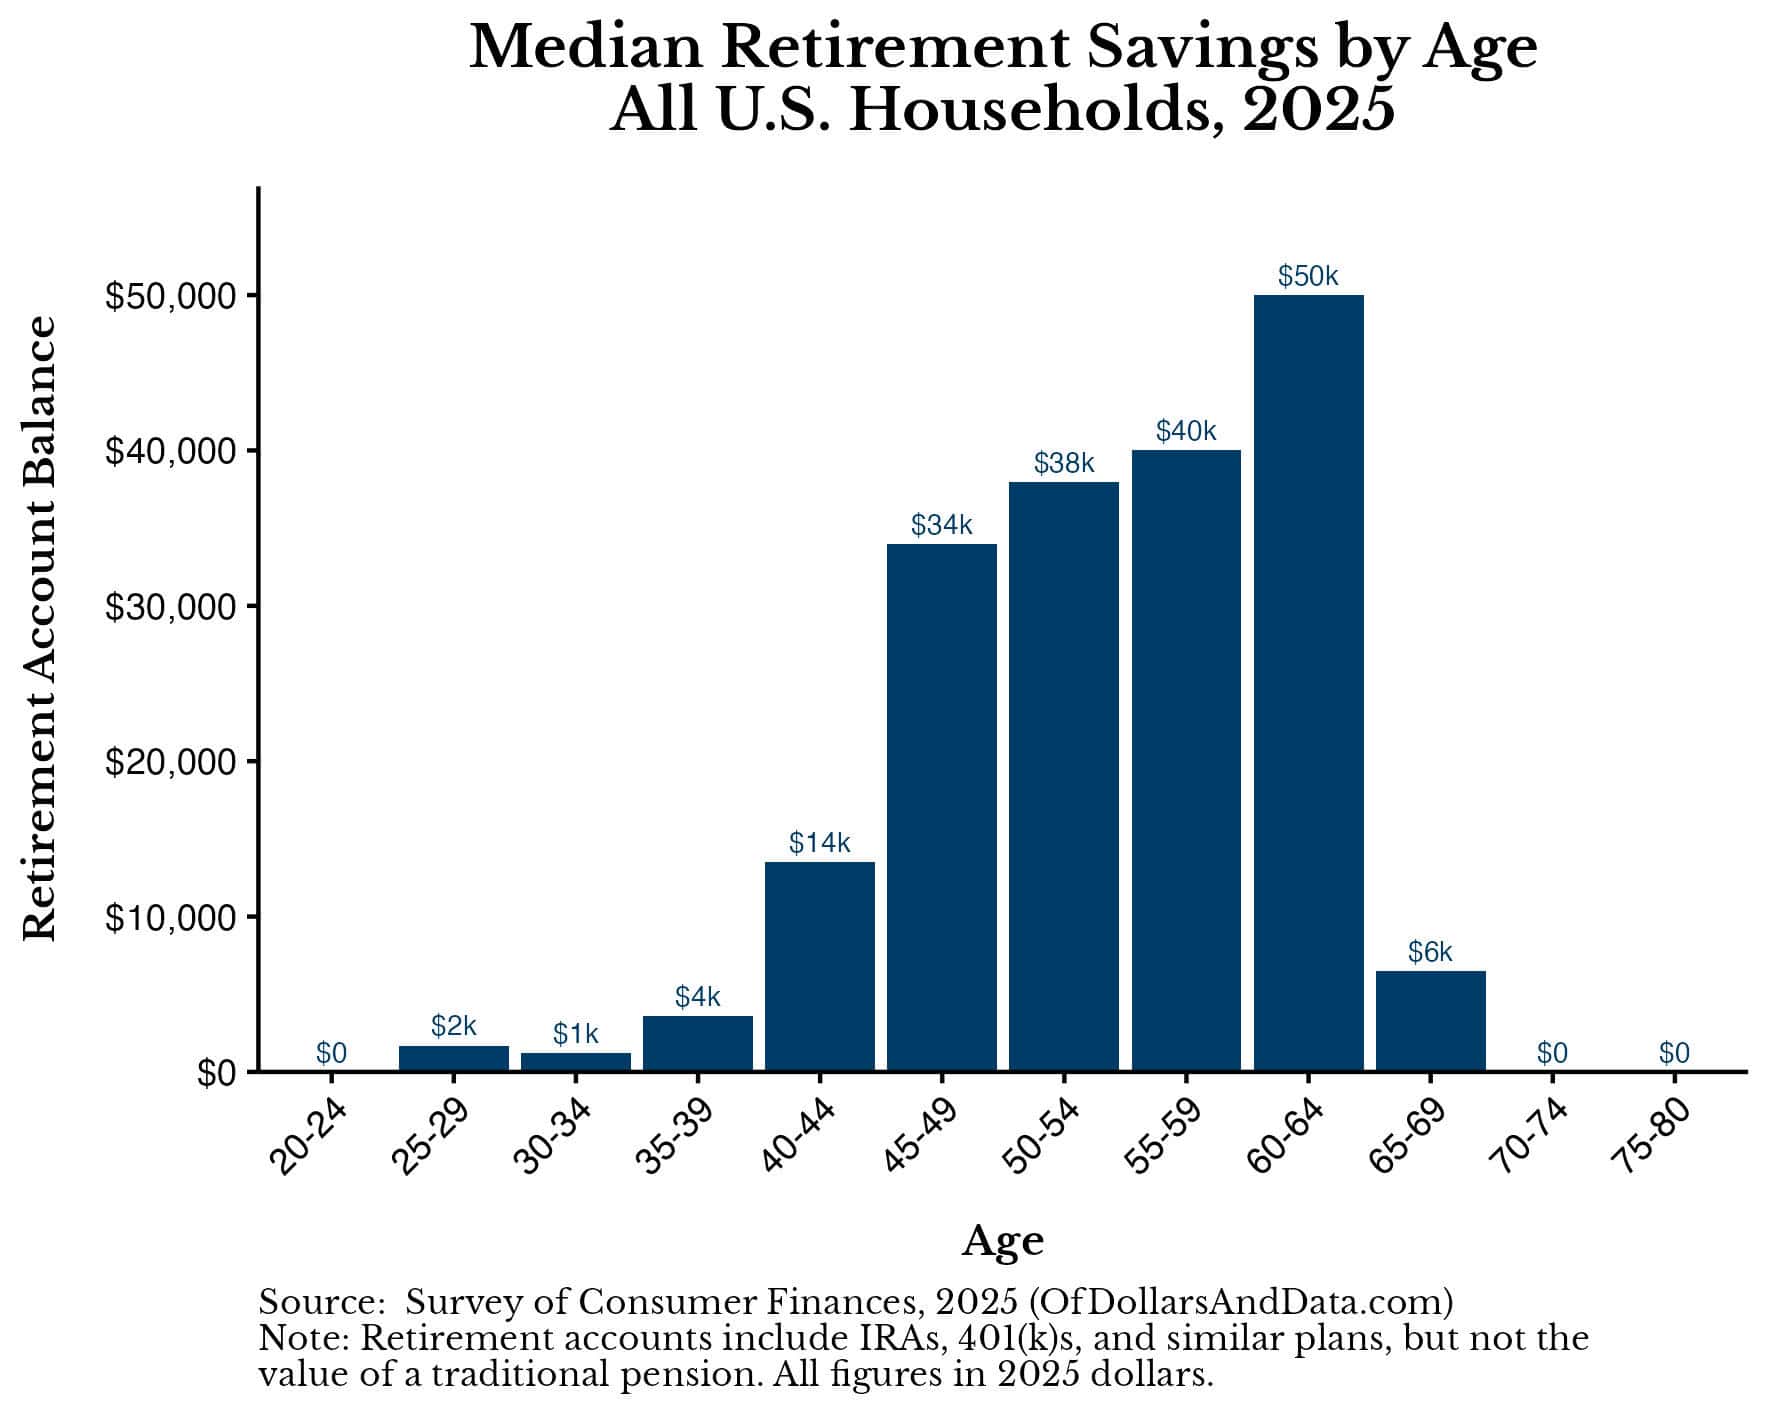
Why is this the case? For the youngest, they haven’t had as much time to save money for retirement as older households. And for the oldest, it’s a combination of having less access to defined contribution retirement accounts while working (a cohort effect) and spending down their retirement savings (an age effect).
But the second reason why the median retirement balance is so low is that many Americans don’t have retirement accounts to begin with. If you look at the percentage of households that have a retirement account by age, you can see this more clearly:
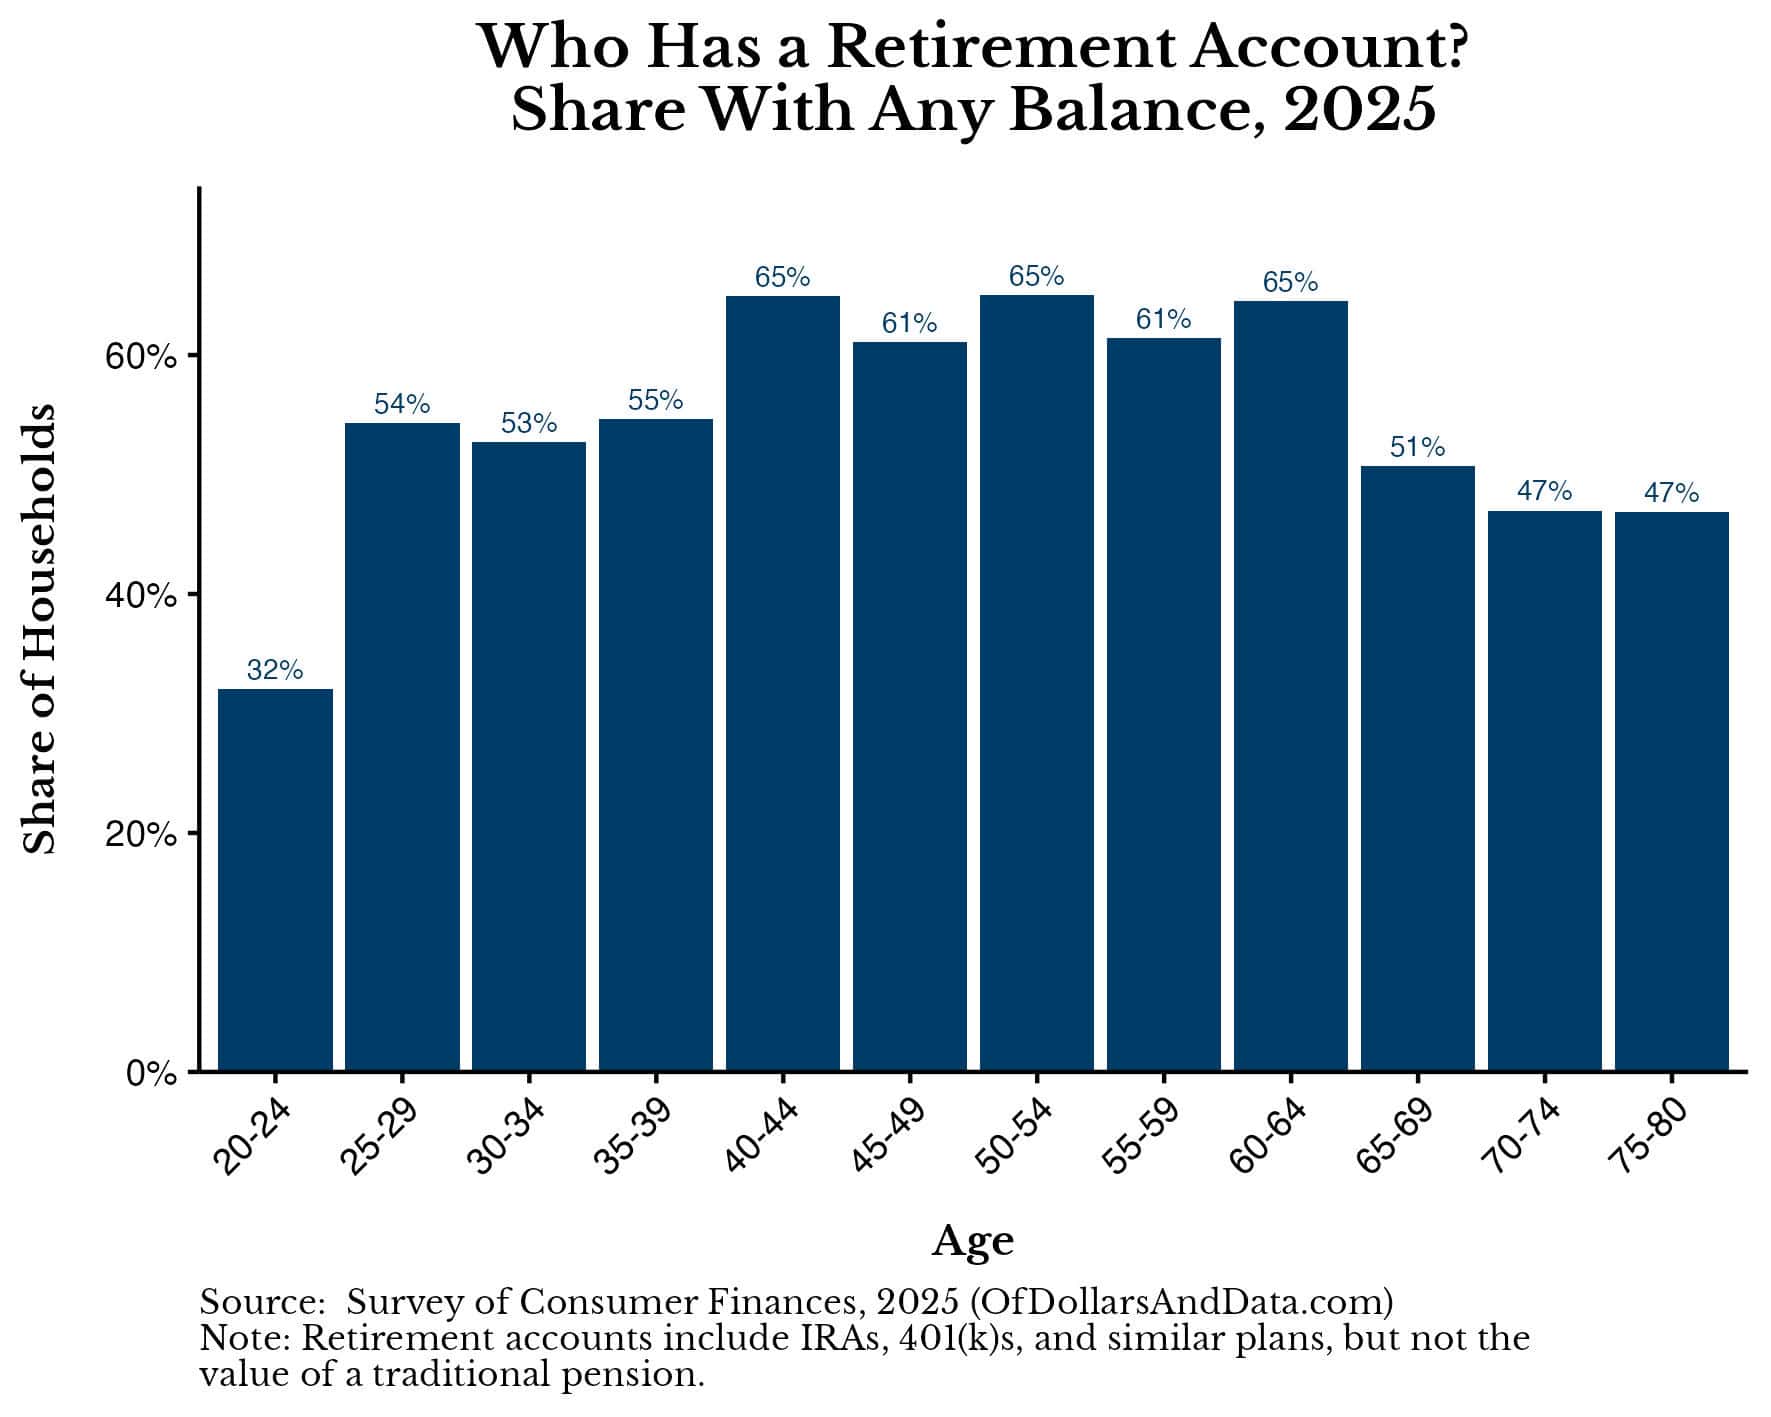
Regrettably, 35% of households (or more) in every age bracket do not have a retirement account.
Why is this the case? Because many lower-income jobs don’t offer them.
When we break down U.S. households by their income quintile (e.g., top 20%, 60-80%, etc.), we can see that higher-income households are more likely to have a retirement account than lower-income ones:
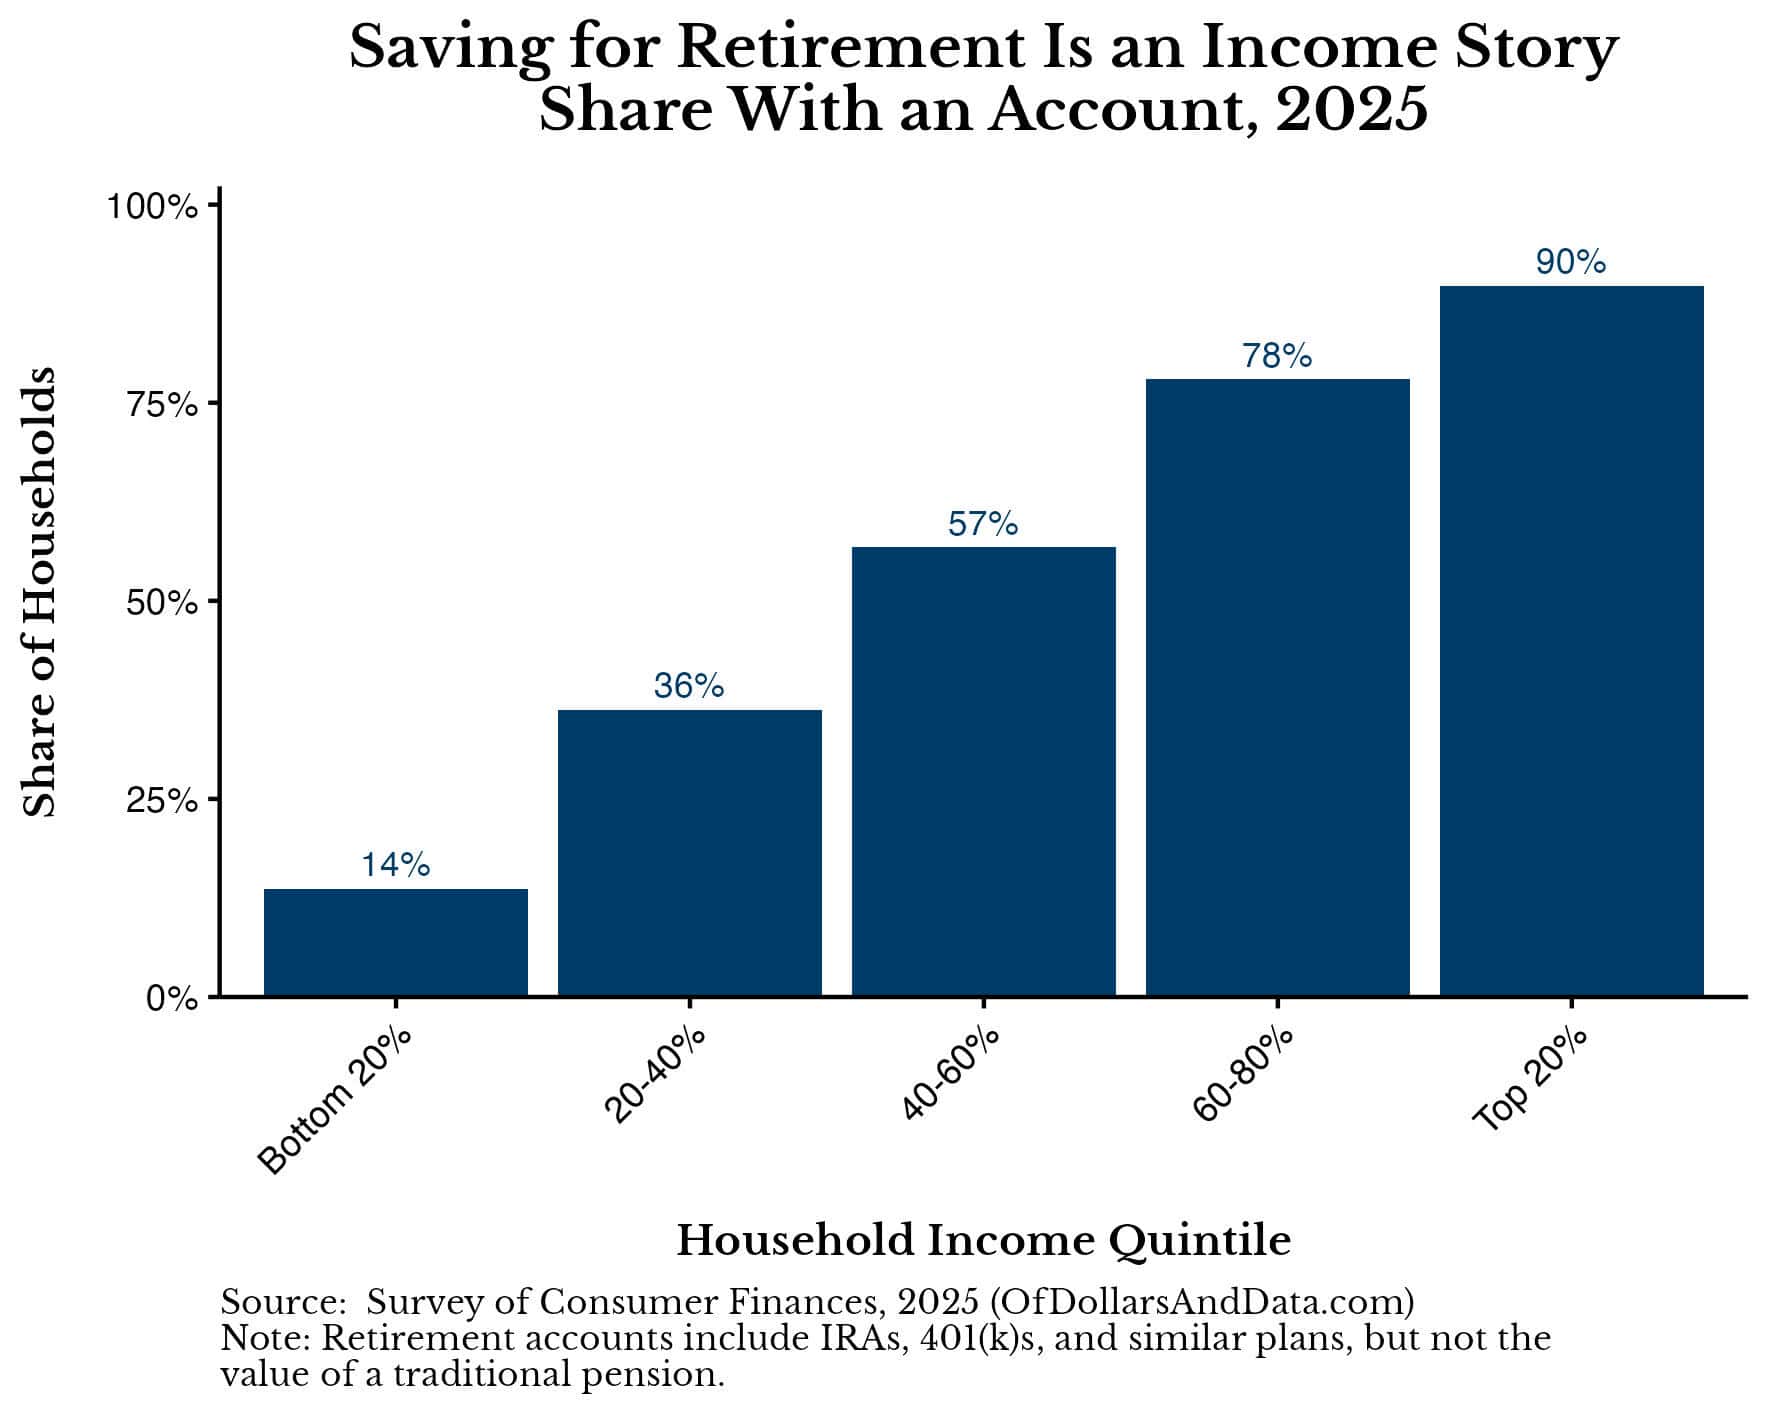
And all of these lower-income households without retirement accounts end up dragging down the median retirement balance.
We can control for this by comparing the median retirement balance among those with retirement accounts (vs. all households) to get a better picture:
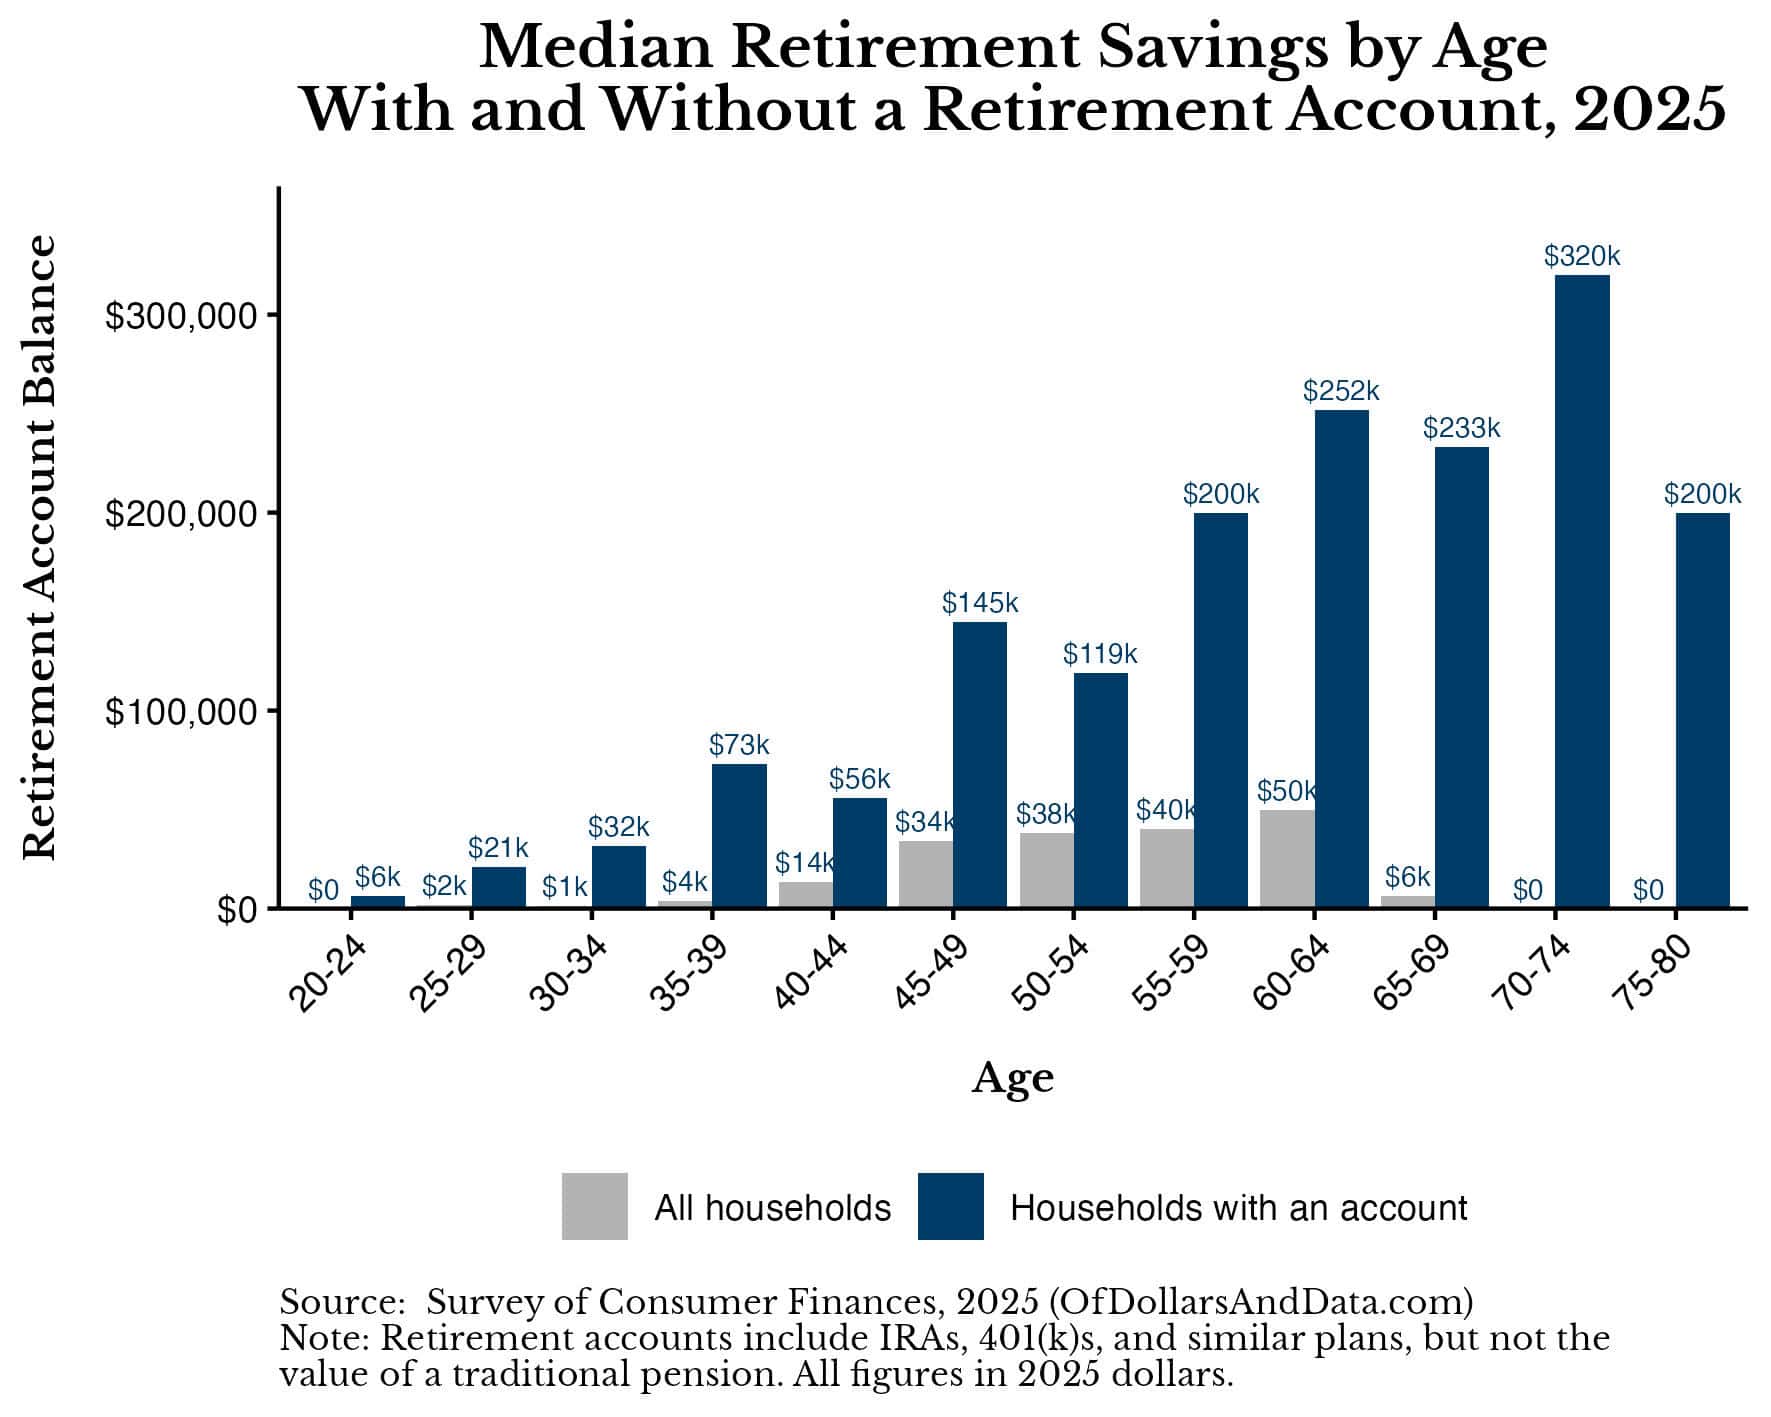
Once we subset to those with retirement accounts, the median shoots upward to $106k. This is better than among all U.S. households, but it is technically being dragged down by younger households.
To control for this, we can look at the median retirement balance among households 60-64 with a retirement account, which is $252k (see chart above). While this is better than $106k, and far better than the overall median of $5k, it’s still below the amount needed to reach the income benchmarks highlighted earlier.
This illustrates how most Americans aren’t close to hitting these retirement savings benchmarks. So let’s turn to how many are.
How Many Americans Hit the Benchmark?
If we look at the median retirement account to income ratio among U.S. households (earning at least $20k) by age, we would see that the median household is nowhere near the benchmark:
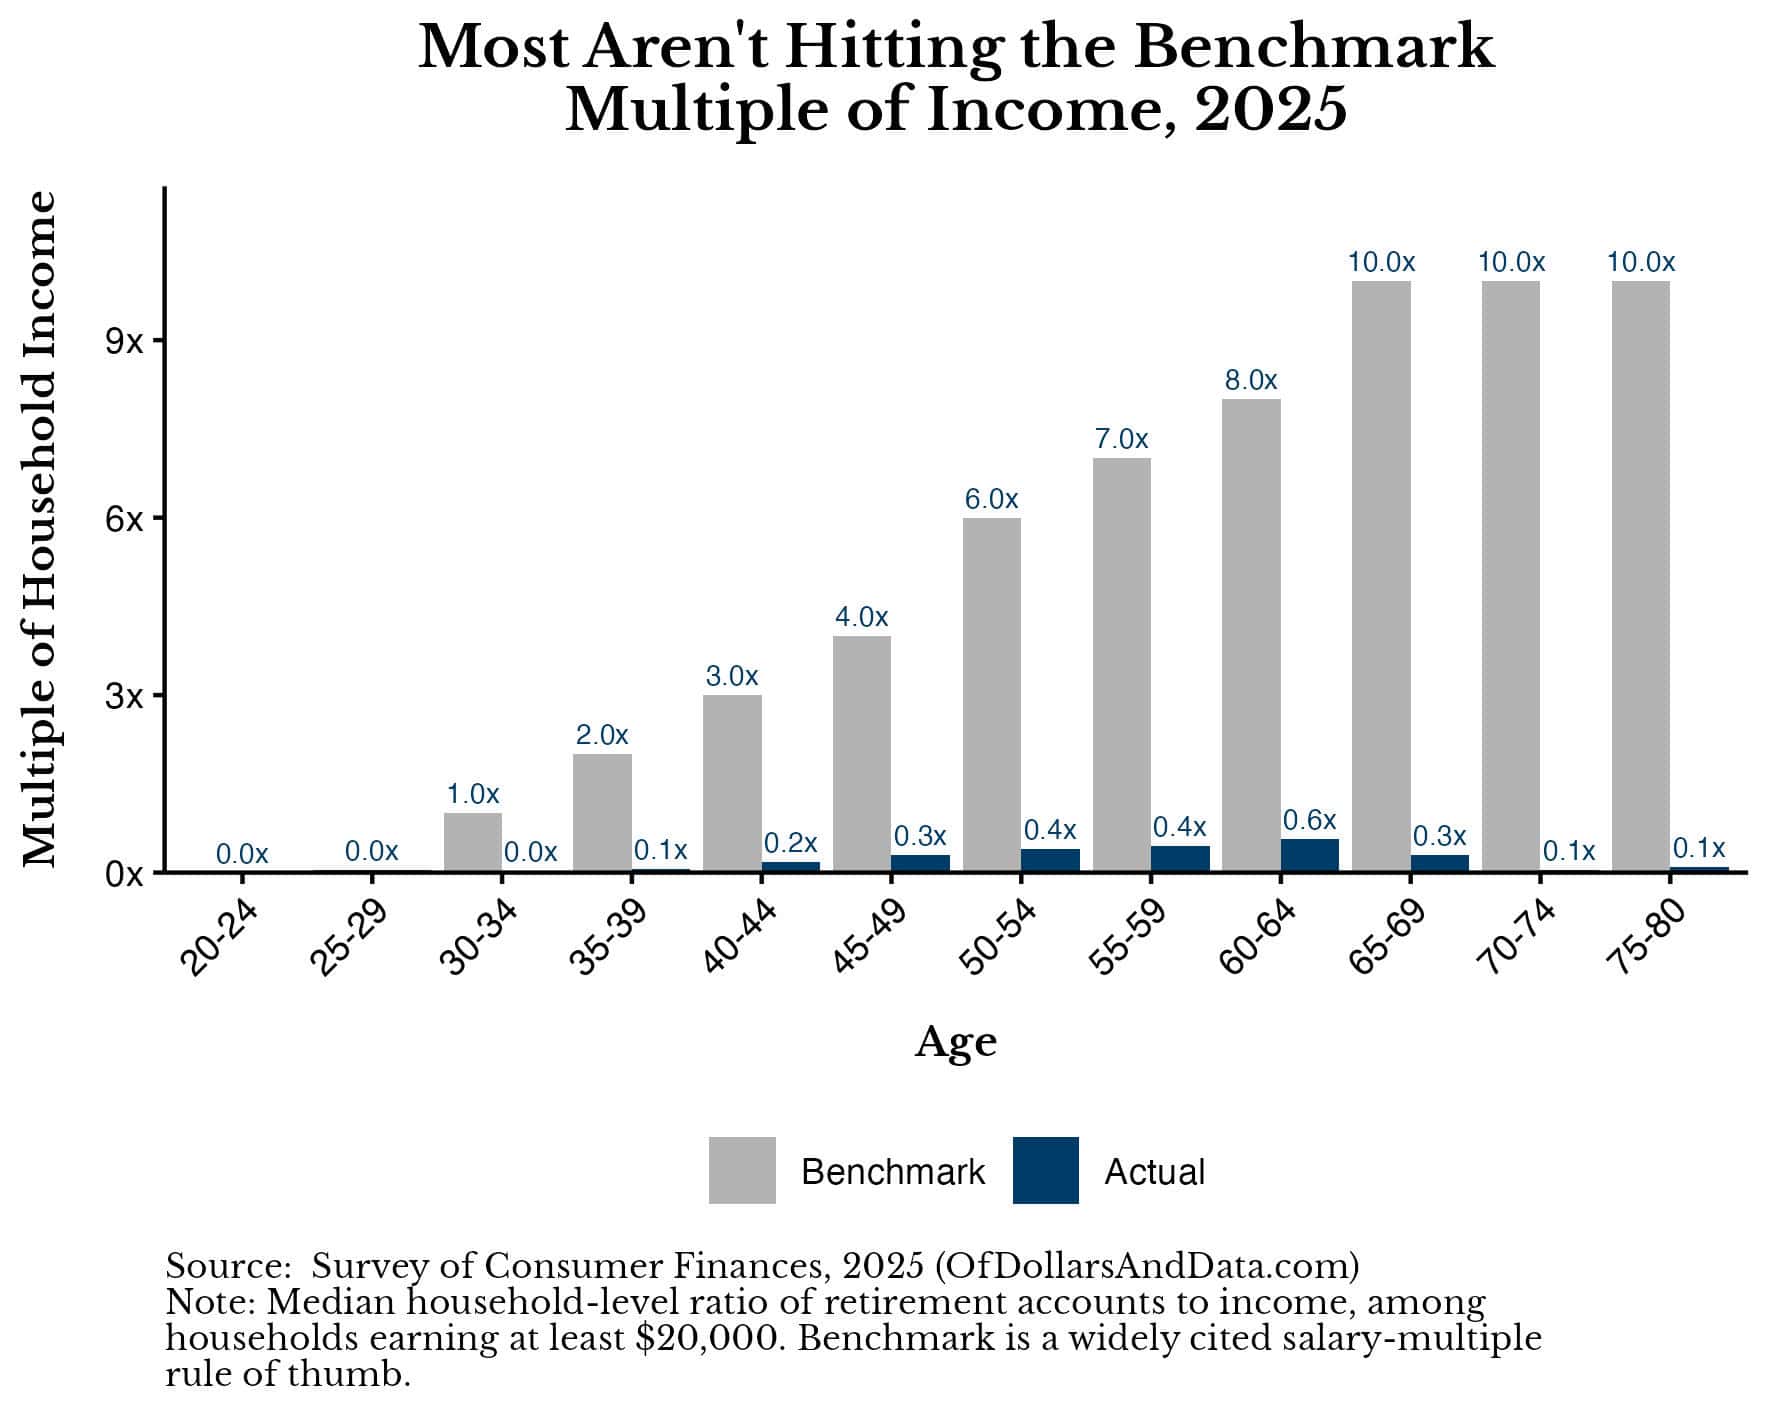
Unfortunately, the median retirement account balance over income is less than 1x across all ages. This is partly because so many U.S. households have no retirement savings.
But some do have retirement savings, and quite a lot. You can see this if you look at the 25th, 50th, 75th, and 90th percentiles of retirement savings by age:
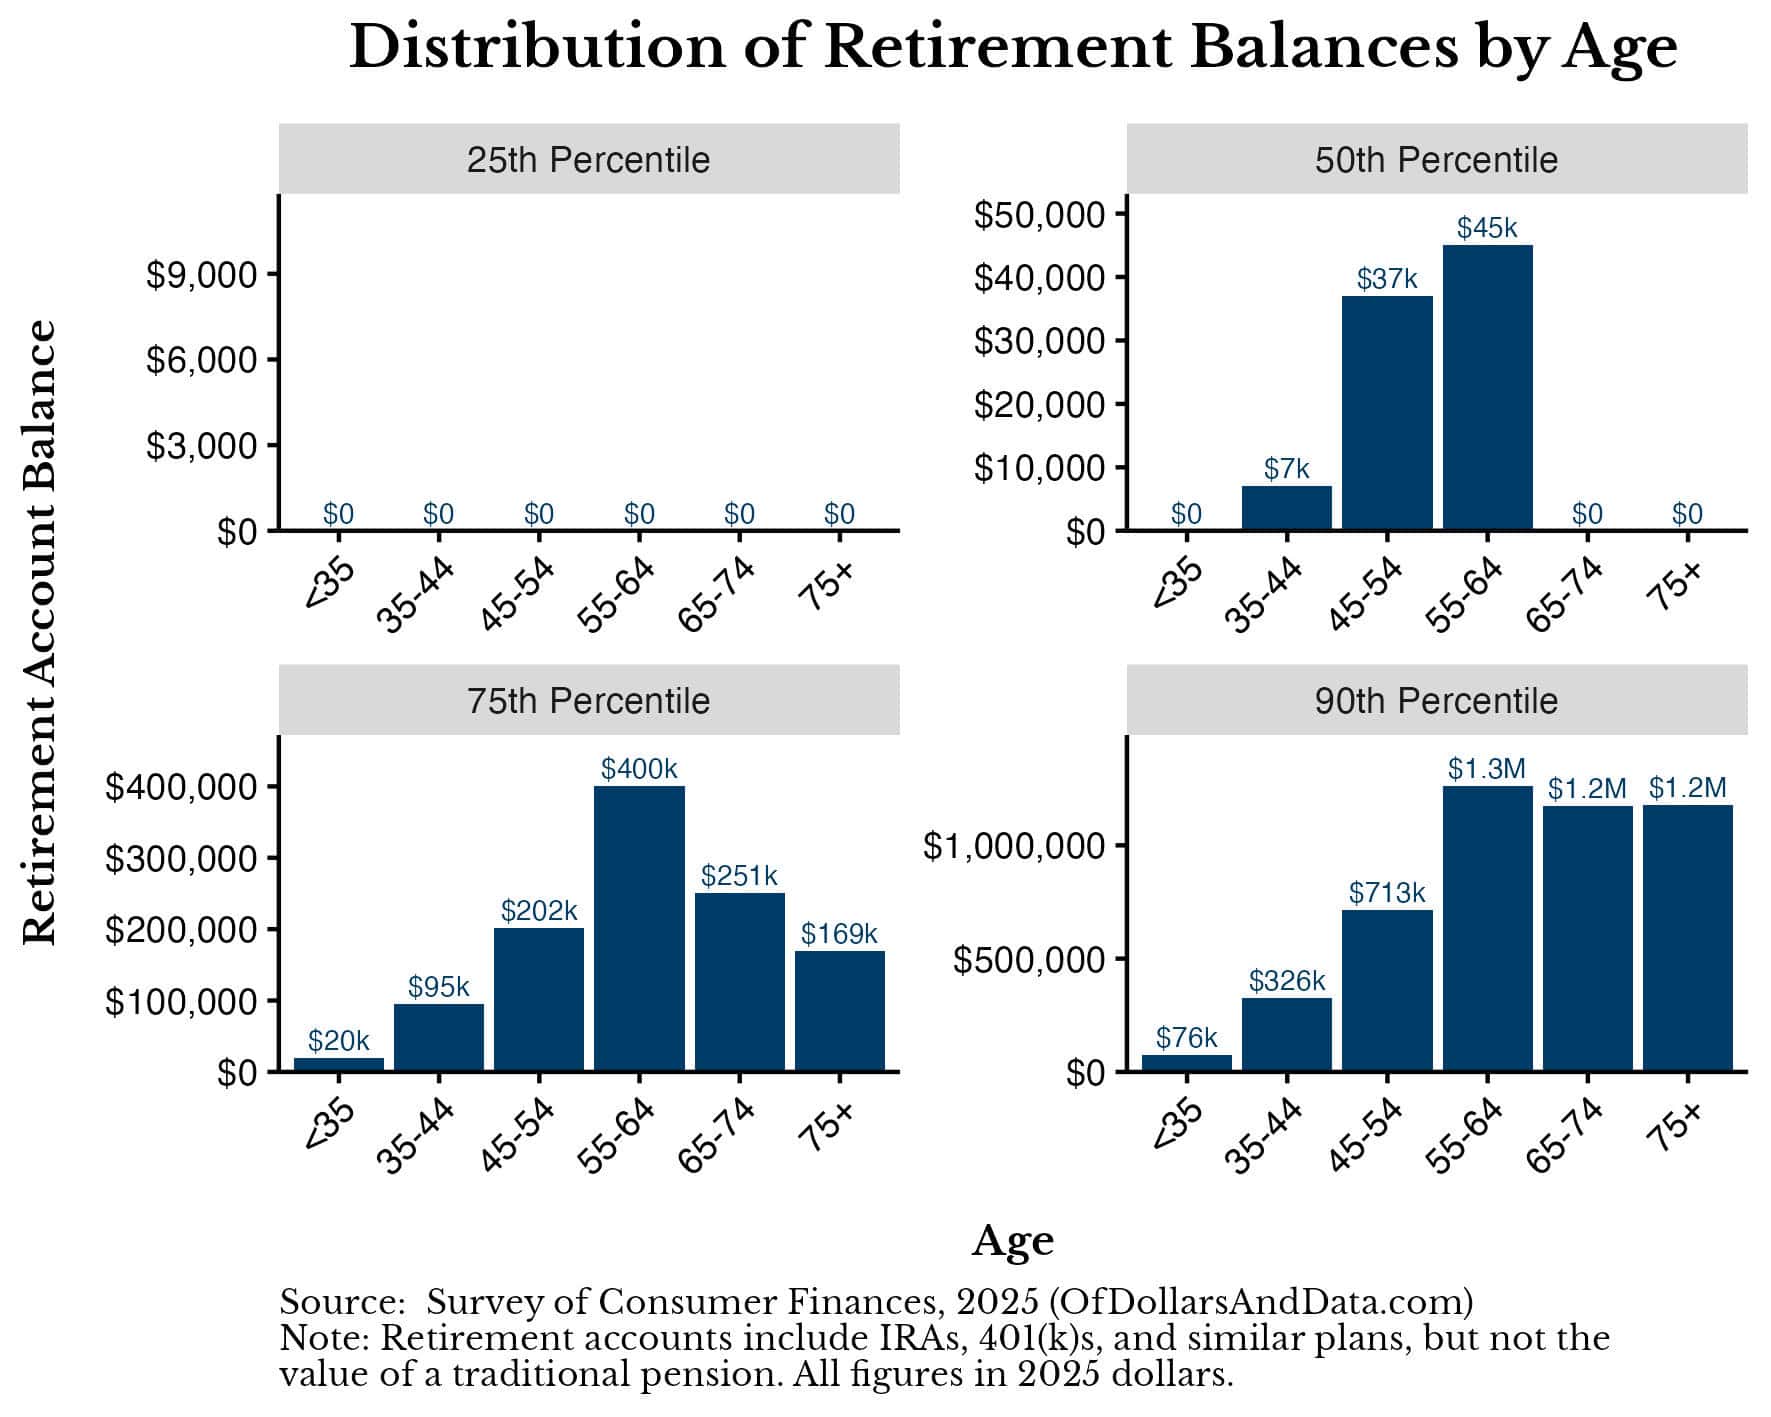
Though a large minority of U.S. households have no retirement savings, a small minority have over a million socked away.
Putting it all together, what percentage of these households actually hit the income/retirement savings benchmarks? Only about 3%-9% (though it varies by age):
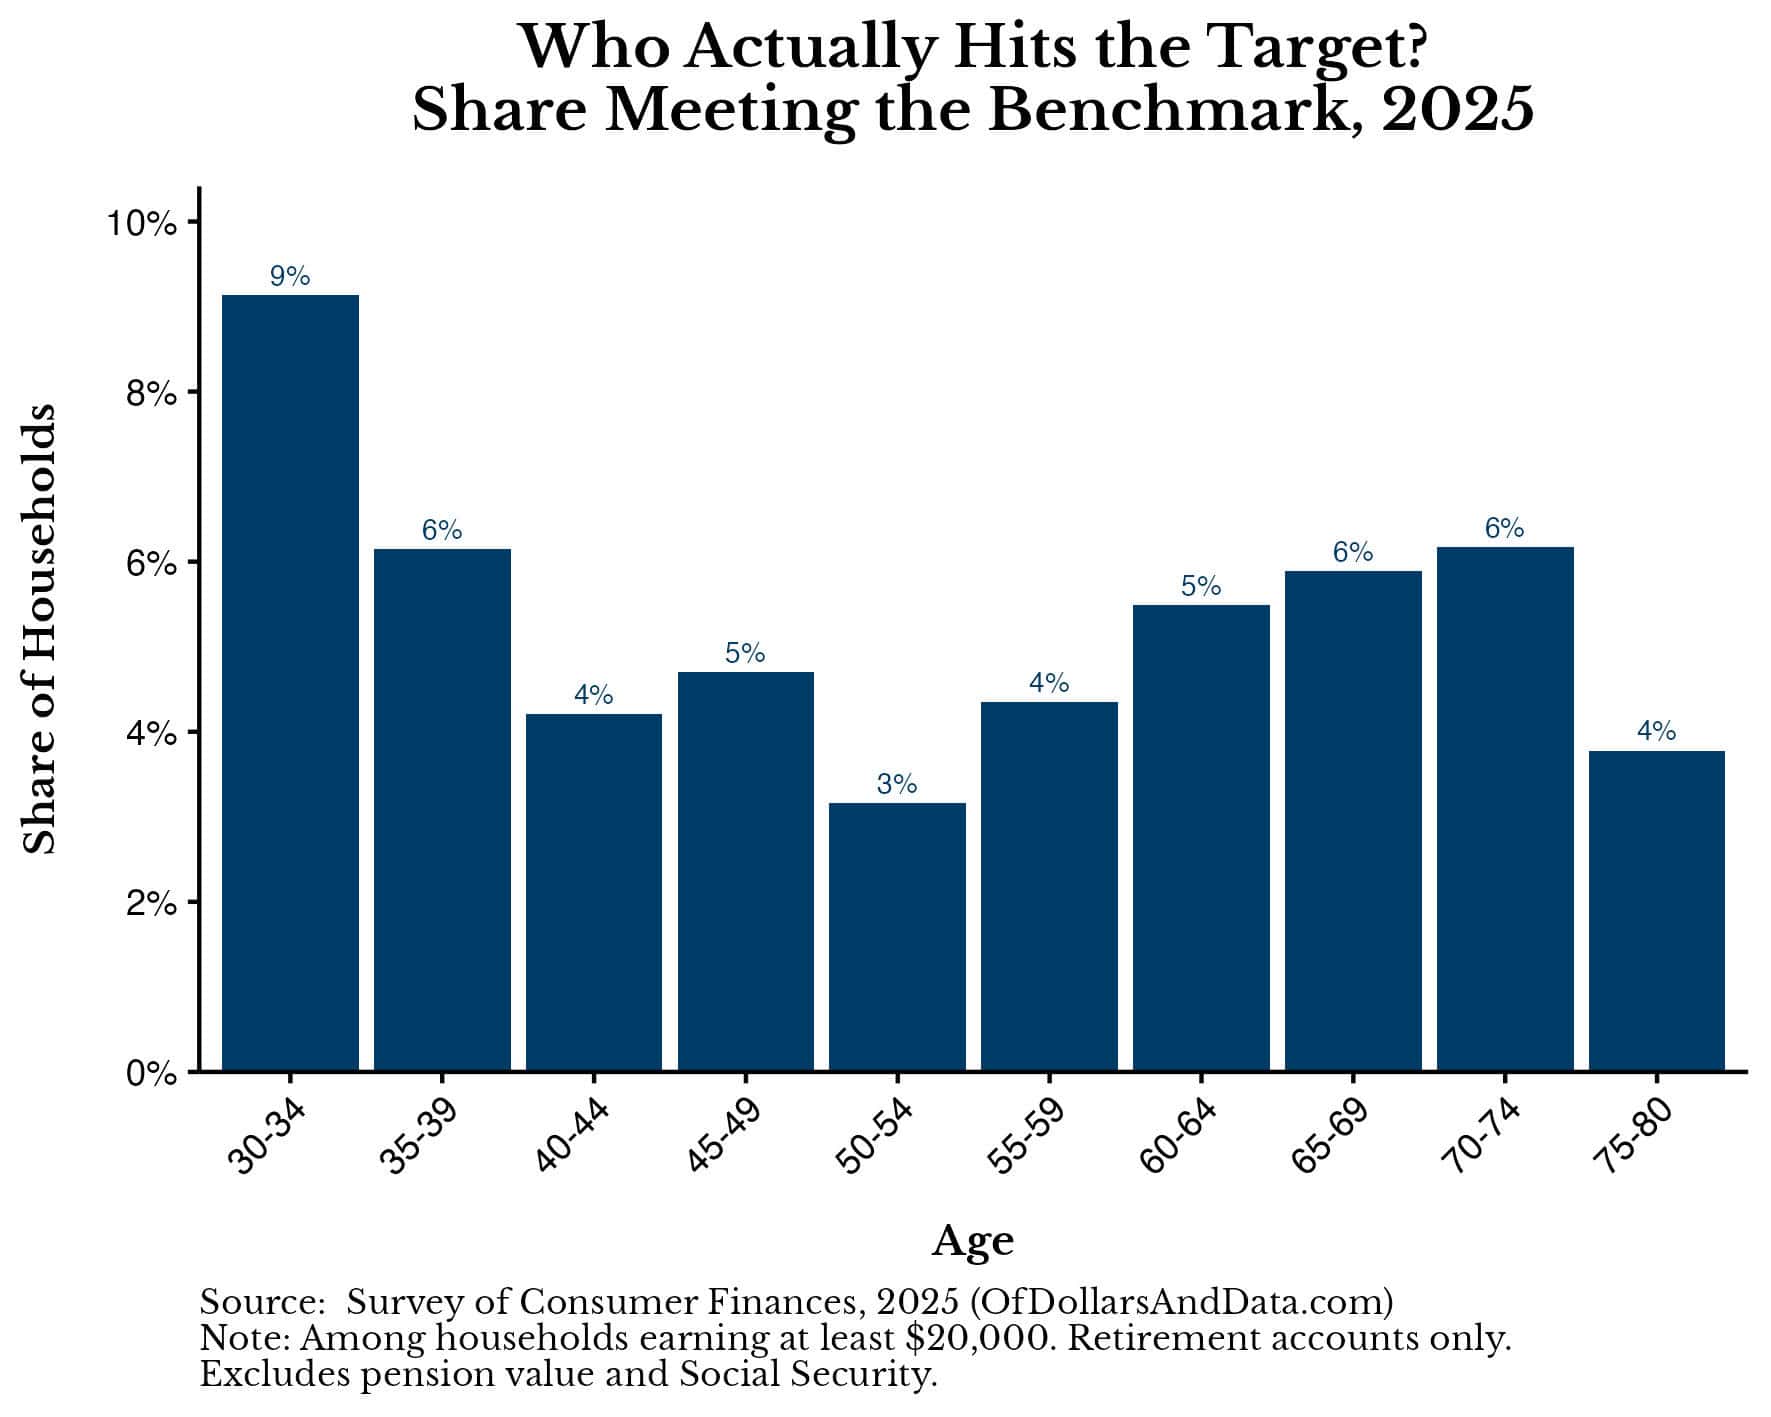
I understand that these benchmarks are supposed to be aspirational, but if more than 90% of households don’t meet them, then either most Americans aren’t saving enough or the benchmark is missing something.
The answer seems to be a bit of both. Yes, American households could be saving more. When at least 35% of U.S. households in every age bracket have no retirement accounts, that’s a problem.
At the same time, using someone’s income as a guide to how much they should save for retirement is misguided. As I’ve discussed before, Social Security replaces a much larger share of income for lower earners than higher earners. So using the same income multiple for both doesn’t make sense.
More importantly, these benchmarks ignore your spending, which is arguably the most important factor when it comes to saving for retirement.
Imagine two households that both earn $100k a year. One saves $50k (and spends $50k) while the other saves $20k (and spends $80k). If we assume that they both want to spend the same amount of money in retirement as they did while working (i.e., lifestyle maintenance), then the one spending $50k a year will need less to retire than the one spending $80k a year.
In other words, the higher your savings rate, the less you need in retirement because you are already living on less. A higher savings rate also means that you will reach retirement sooner, all else equal.
This is why income multiples are the wrong way to measure your retirement progress. It’s your spending that you should focus on instead.
A Better Way to Benchmark Your Retirement Savings
If you want to know how well you’re saving for retirement, calculate each of the following:
- Annual Retirement Spending: Figure out how much you want to spend annually in retirement (in today’s dollars).
- Uncovered Retirement Spending: From your retirement spending, subtract any income you expect in retirement (e.g., Social Security, pension, etc.). The amount you have left is your uncovered retirement spending, aka what you have to save for.
- Future Retirement Need: Multiply your uncovered retirement spending by 25 to get your total future retirement need. This assumes a 4% withdrawal rate in retirement.
- Years Until Retirement: Count how many years until you reach retirement.
- Current Retirement Need: Take your Future Retirement Need and divide by (1.05^Years Until Retirement). This assumes a 5% return on your retirement assets (above inflation) until you reach retirement.
For example, here are the numbers using my own retirement estimates:
- Annual Retirement Spending: $150k
- Uncovered Retirement Spending: $114k (or $9.5k/month). This assumes that I get $36k/year (or $3k/month) in Social Security, a 25% reduction in expected benefits.
- Future Retirement Need: $2.85M [$114k * 25]
- Years Until Retirement: 31 (assumes full retirement age of 67)
- Current Retirement Need: $628,025 [$2,850,000/(1.05^31)]
Please run your numbers to see where you land. Once you do, then you can compare your current retirement savings (i.e., how much you have saved for retirement across all accounts) to your Current Retirement Need.
If your current retirement savings are above your Current Retirement Need, then you’re in amazing shape because you don’t need to save more for retirement. Why? Because once you hit your Current Retirement Need, we assume that your assets keep growing at a 5% rate until you reach retirement. And with 5% annual growth (above inflation), this means that your Current Retirement Need becomes your Future Retirement Need. For the uninitiated, this is basically how Coast FIRE works. You save until a certain point, then you coast.
However, if your current retirement savings are below your Current Retirement Need, then you will either need to save more while working or reduce your future spending in retirement. Don’t be discouraged if this applies to you, as it applies to many people (especially if you are younger).
For example, when I was 22 years old, my Current Retirement Need was $317,195 [$2,850,000/(1.05^45)]. However, I had $0 saved for retirement since I had just started working. A decade later my Current Retirement Need had increased to $516,677 [$2,850,000/(1.05^35)]. Thankfully, my retirement savings (at the time) were over half of this amount, meaning that the gap between my current retirement savings and my Current Retirement Need had decreased over time.
This gap between your retirement savings and your Current Retirement Need should be largest when you first start working. More importantly, it should decrease over time as you save and invest your money.
I recommend running your numbers every few years to calculate the distance between your current retirement savings and your Current Retirement Need. Not only does this allow you to see if you are making progress (aka closing the gap), but it will also allow you to adjust along the way as your life and future spending needs evolve.
For example, below is a chart showing Current Retirement Need by age for three different retirement targets ($750k, $1.5M, and $3M). These amounts correspond to $2.5k/month, $5k/month, and $10k/month in uncovered retirement spending:
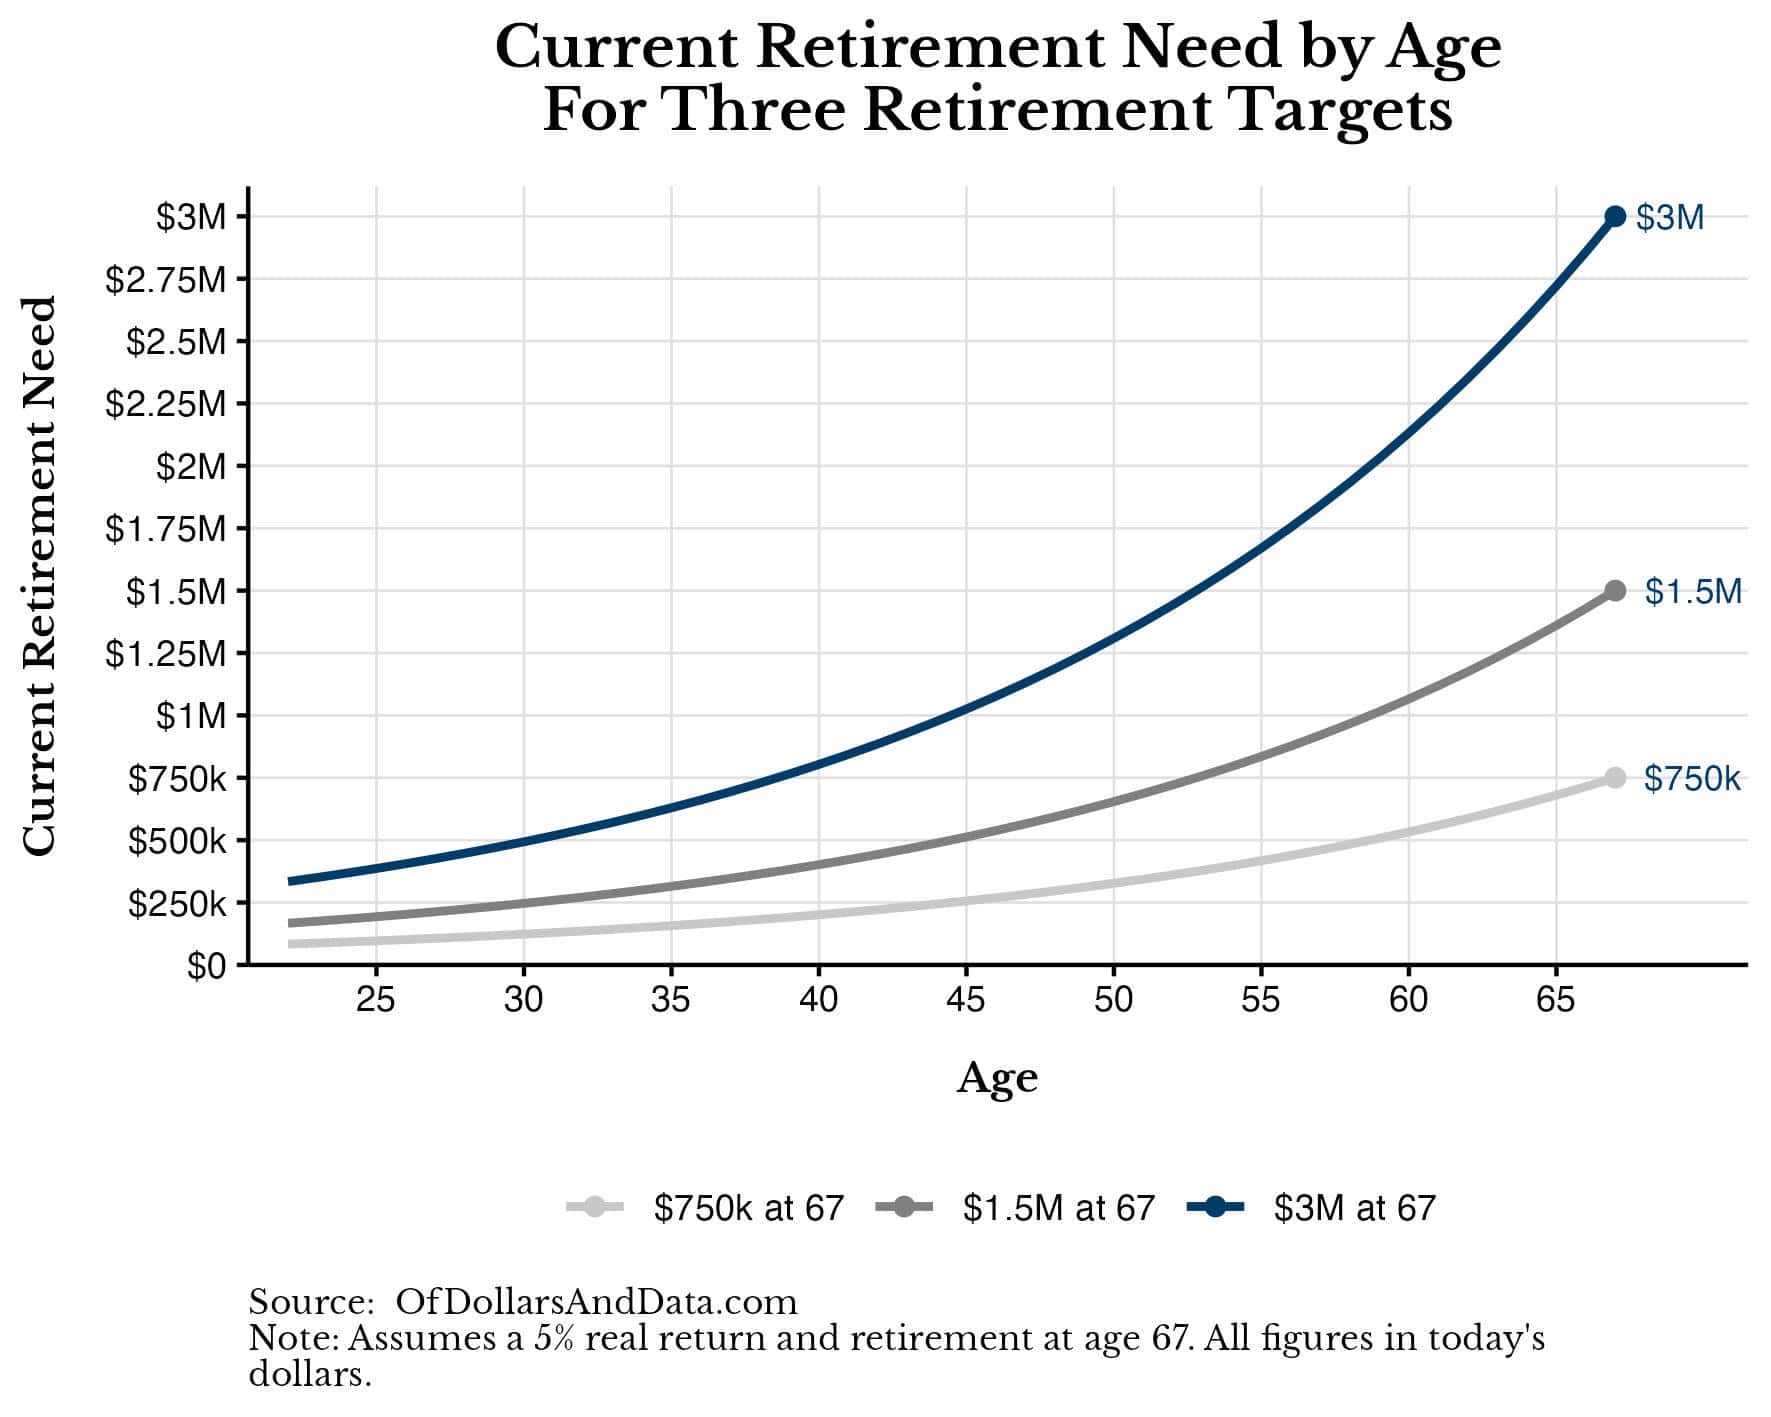
You can easily compare your current retirement savings to these Current Retirement Needs given your age.
I also created a similar chart based on my own assumptions to track my Current Retirement Need by age:
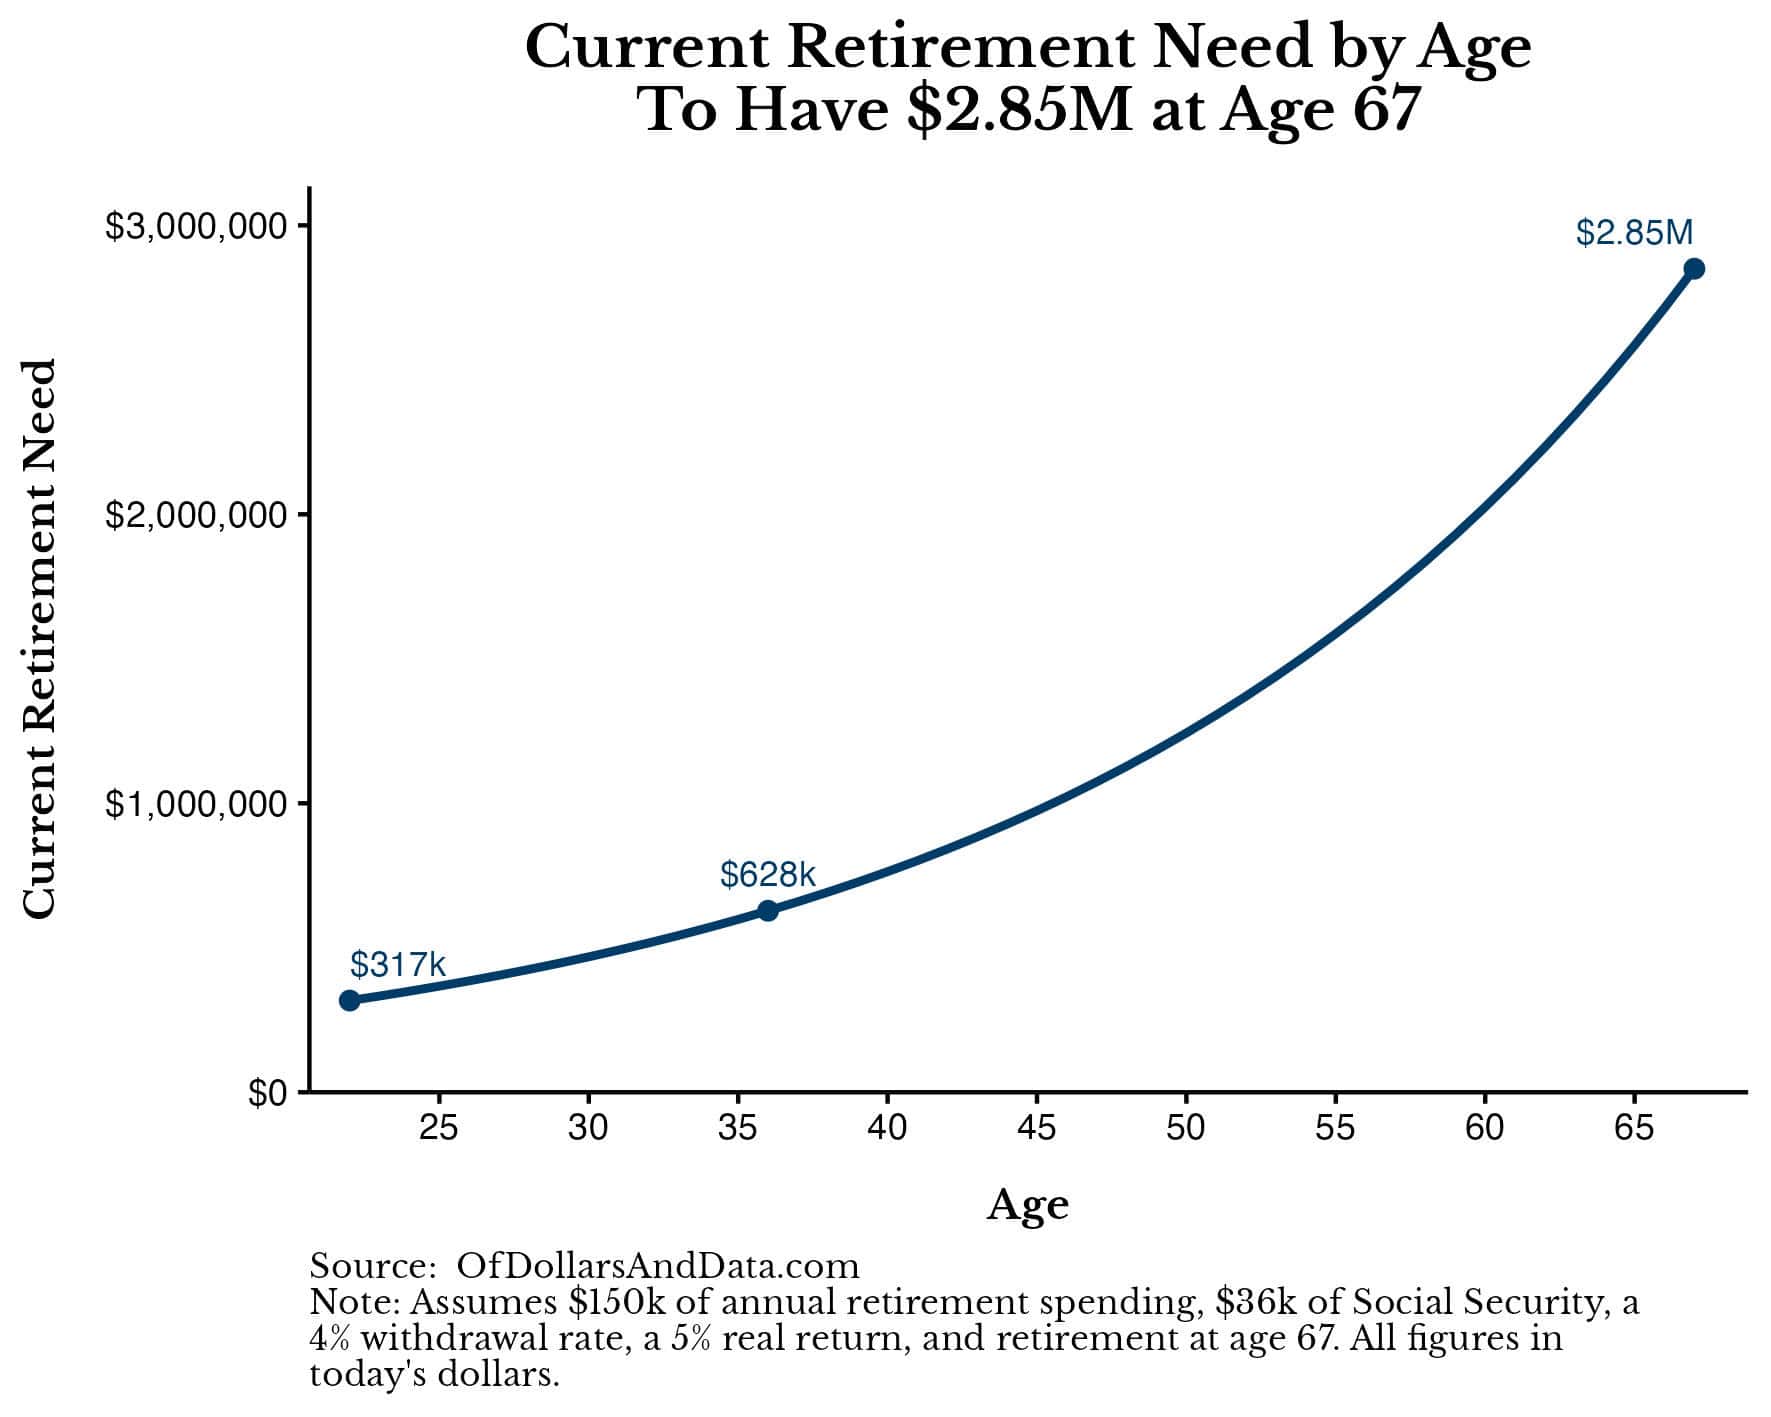
This is what guides my retirement savings. It’s conservative and it works for me. Find what works for you.
Because you can compare your retirement savings to others all you want, but the only retirement number that ultimately matters is your own.
And if you’re a little behind that number, don’t panic. Just Keep Buying and let time do the rest.
Happy investing and thank you for reading!
If you liked this post, consider signing up for my newsletter.
This is post 529. Any code I have related to this post can be found here with the same numbering: https://github.com/nmaggiulli/of-dollars-and-data


0 Comments