

The Federal Reserve conducts its Survey of Consumer Finances once every three years.
It’s like the Olympics or World Cup for econ and finance nerds like me.
The latest results were released a few weeks ago.
Let’s run through some charts to look at trends in household financial data.1
First up, here is median income data:
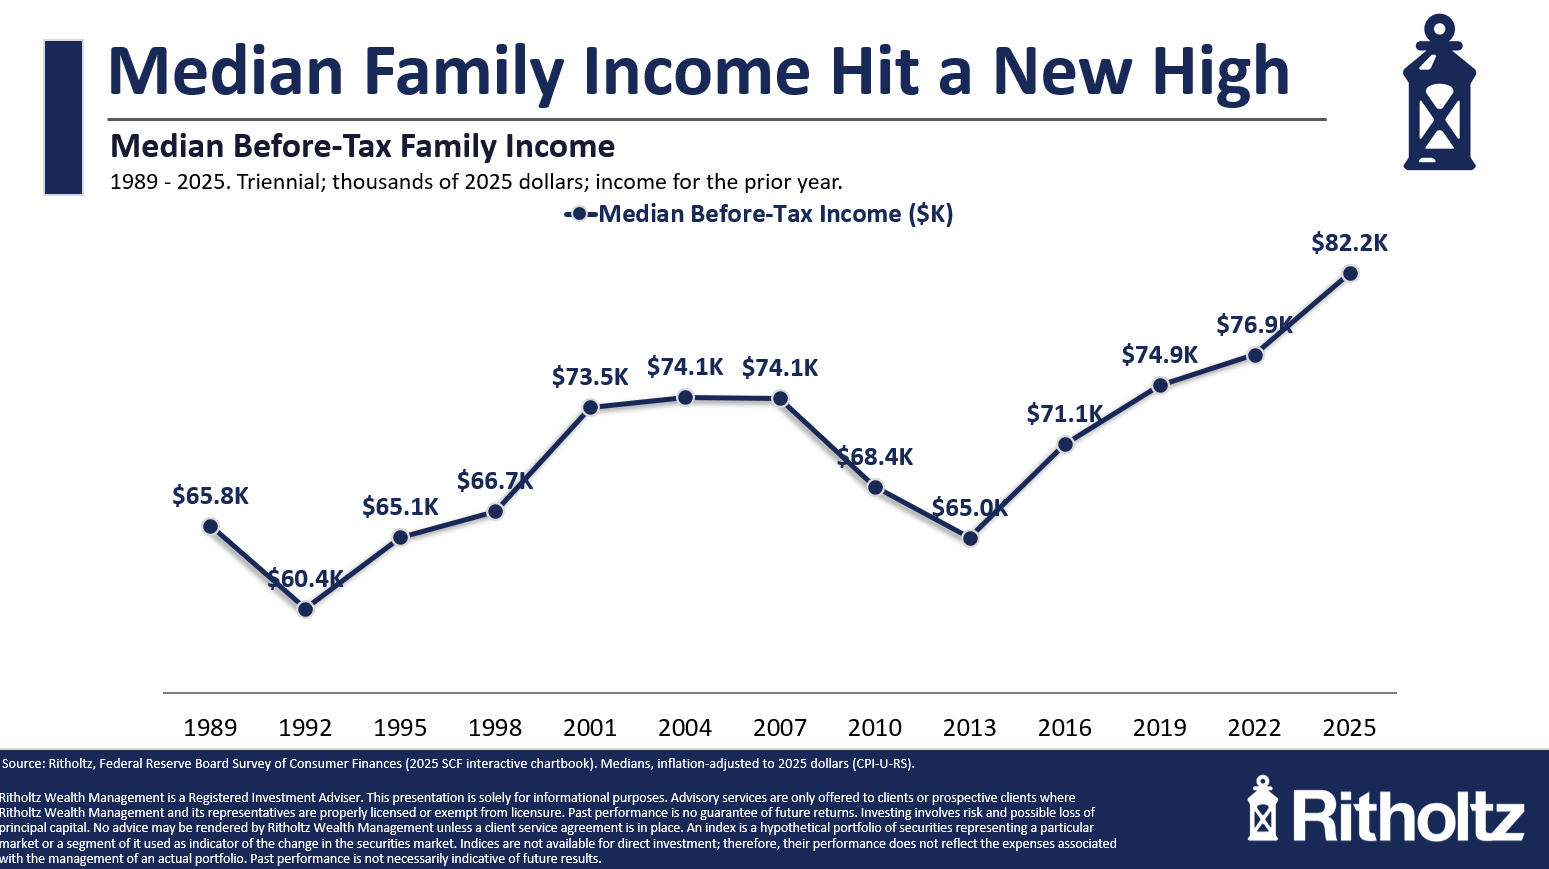
That valley coming out of the Great Financial Crisis was painful.
Even after adjusting for inflation, incomes are up almost 30% from the 2013 lows. It’s hard to believe real incomes were unchanged from 1989 to 2013. It’s good to see this trend going in the right direction.
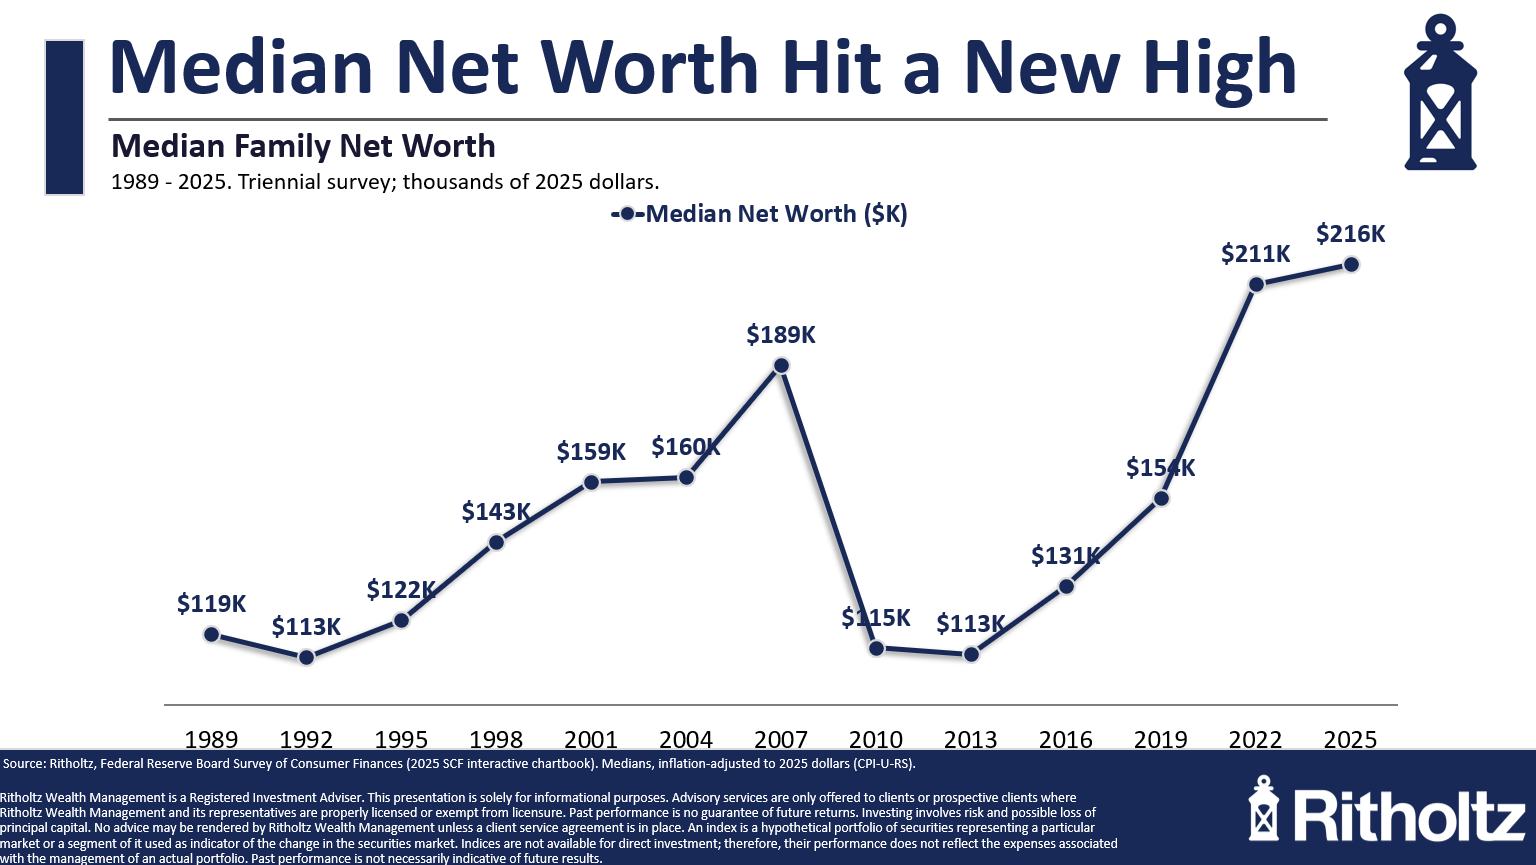
Median net worth has experienced a similar trajectory with a little more volatility:
There was a massive crash from the 2007 highs. That’s not too surprising considering the stock market fell almost 60% while housing prices crashed nearly 30%.
Plus you had 10% unemployment, a nasty recession and a near implosion of the financial system as we know it.
The fact that both housing and stock prices have boomed this decade has helped push median household net worth to new highs.
Things have leveled off a bit in recent years but this is another number heading in the right direction.
Here’s a chart that might surprise you: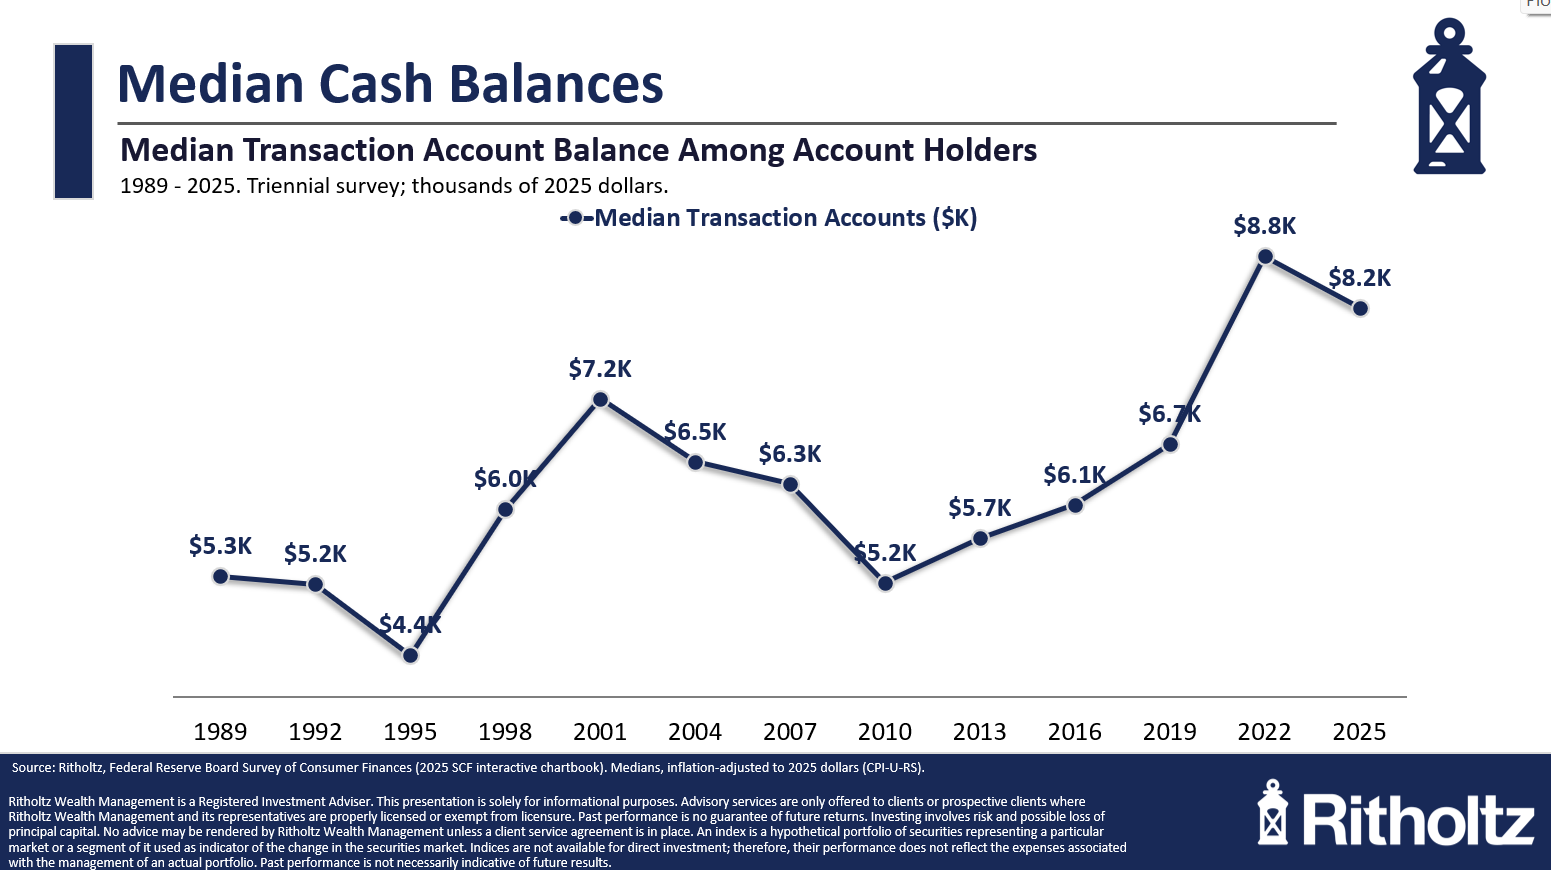
There are always those viral stories that say 60% of American households couldn’t afford a $400 emergency or something.
Well the Fed data shows that the median cash balance for American households is $8,000. That’s not everyone, of course but it’s pretty good and probably better than you think.
This next one is even more surprising: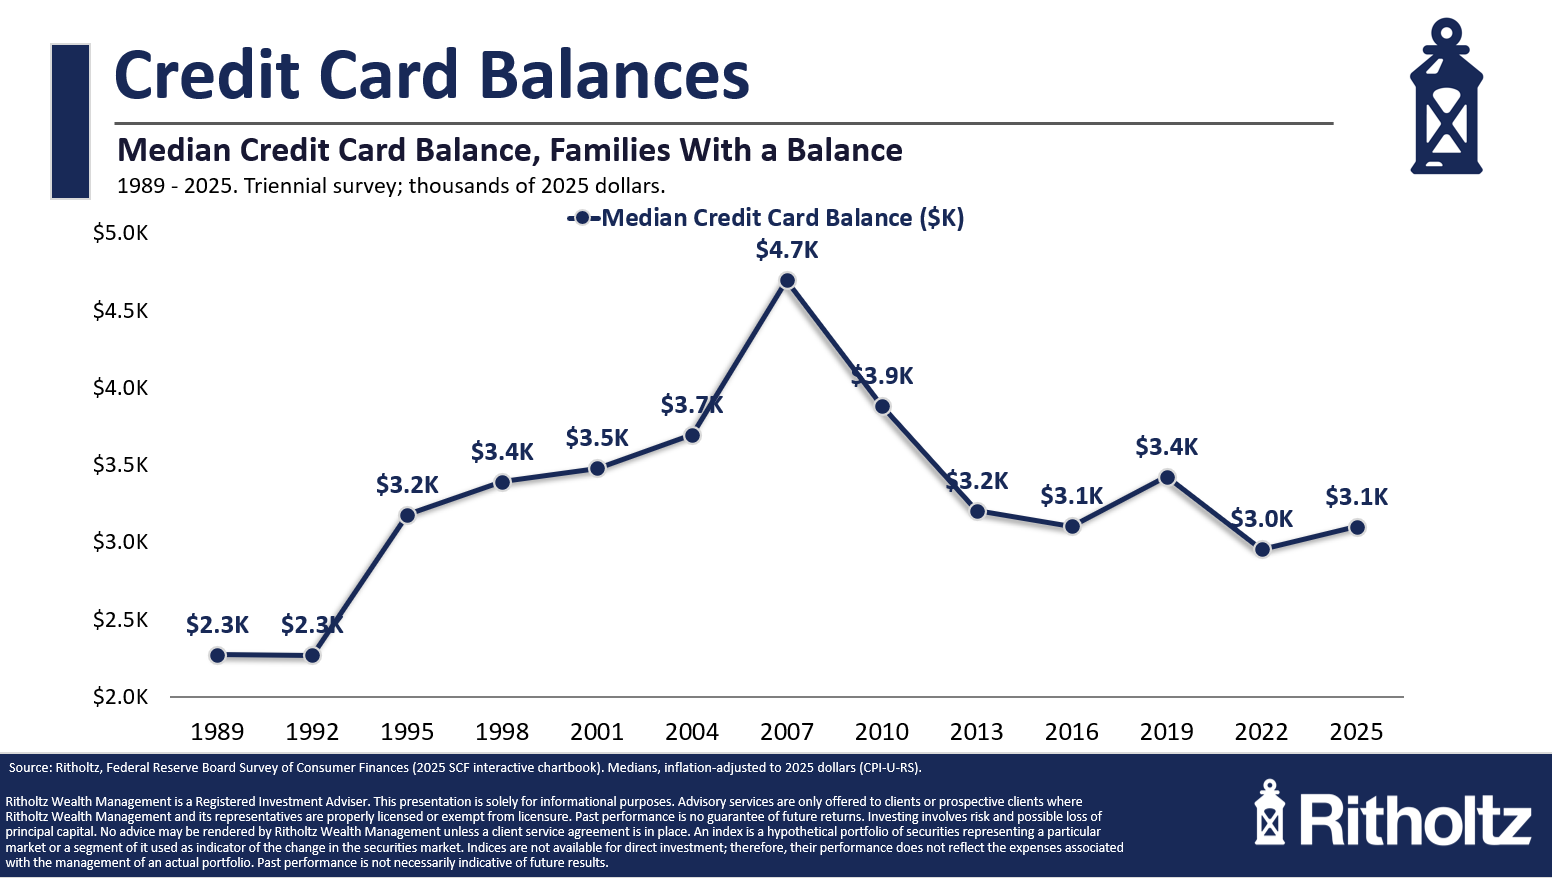
On a real basis, median credit card debt has been falling for years. It’s now way below the pre-GFC crisis days.
This is shocking. Households have repaired their balance sheets so much that there is plenty of firepower if people do need to borrow during the next slowdown.
The Fed also tracks data about how households are feeling about their finances on an annual basis.
I typically prefer data over feelings because you have to watch what people do not what they say. But this data can in instructive in terms of the trends over time.
This one shows the number of households who say they are living comfortably or at least doing okay: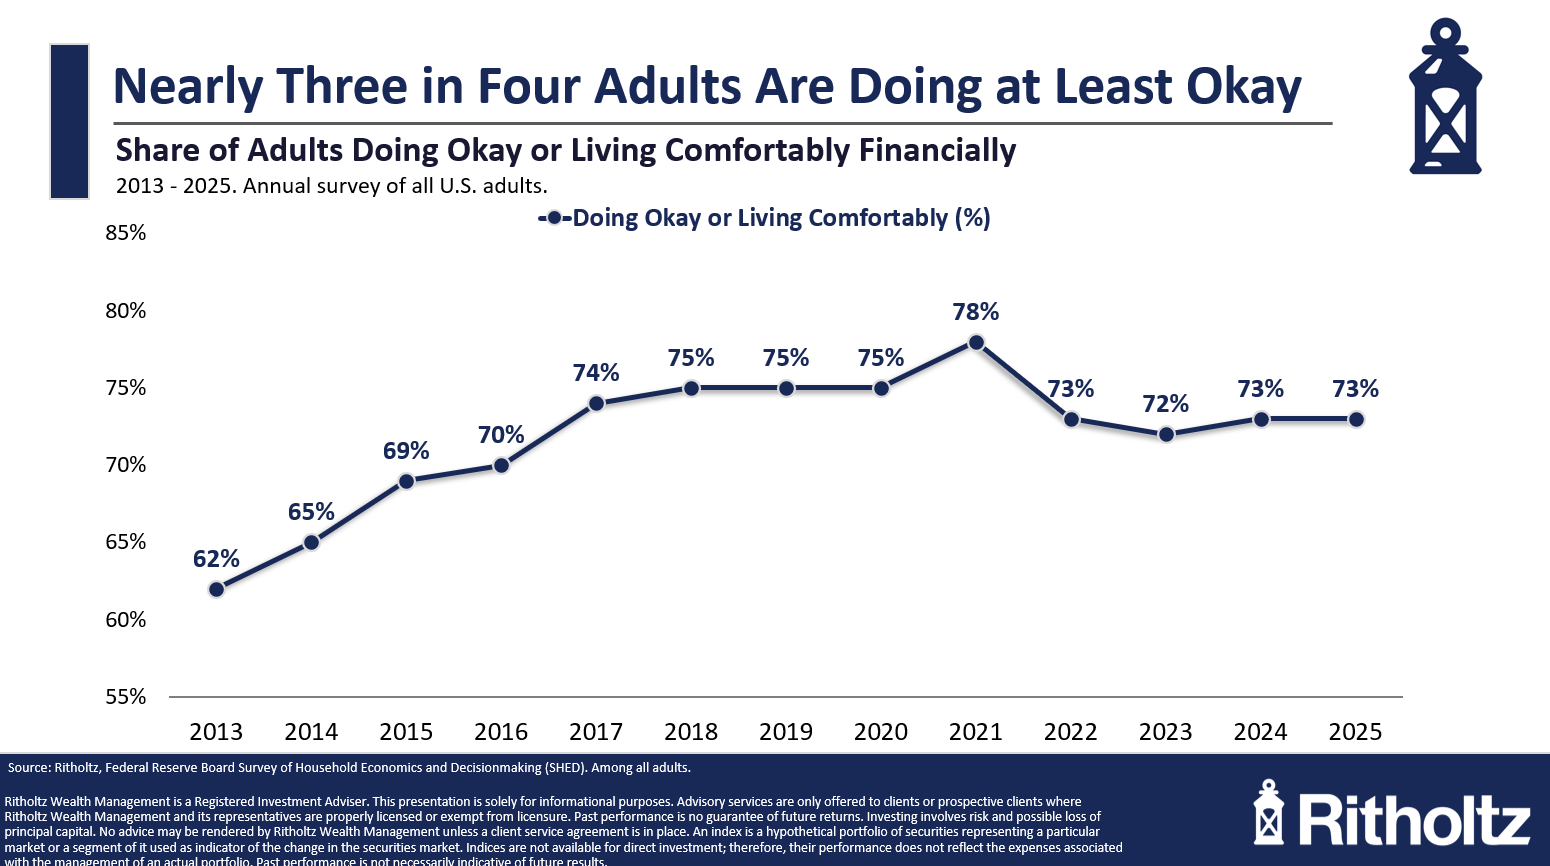
This has been pretty stable over time. It’s down slightly from the early-2020s days of government checks but three-quarters of households claim to be doing okay.
That’s good news.
This is the bad news: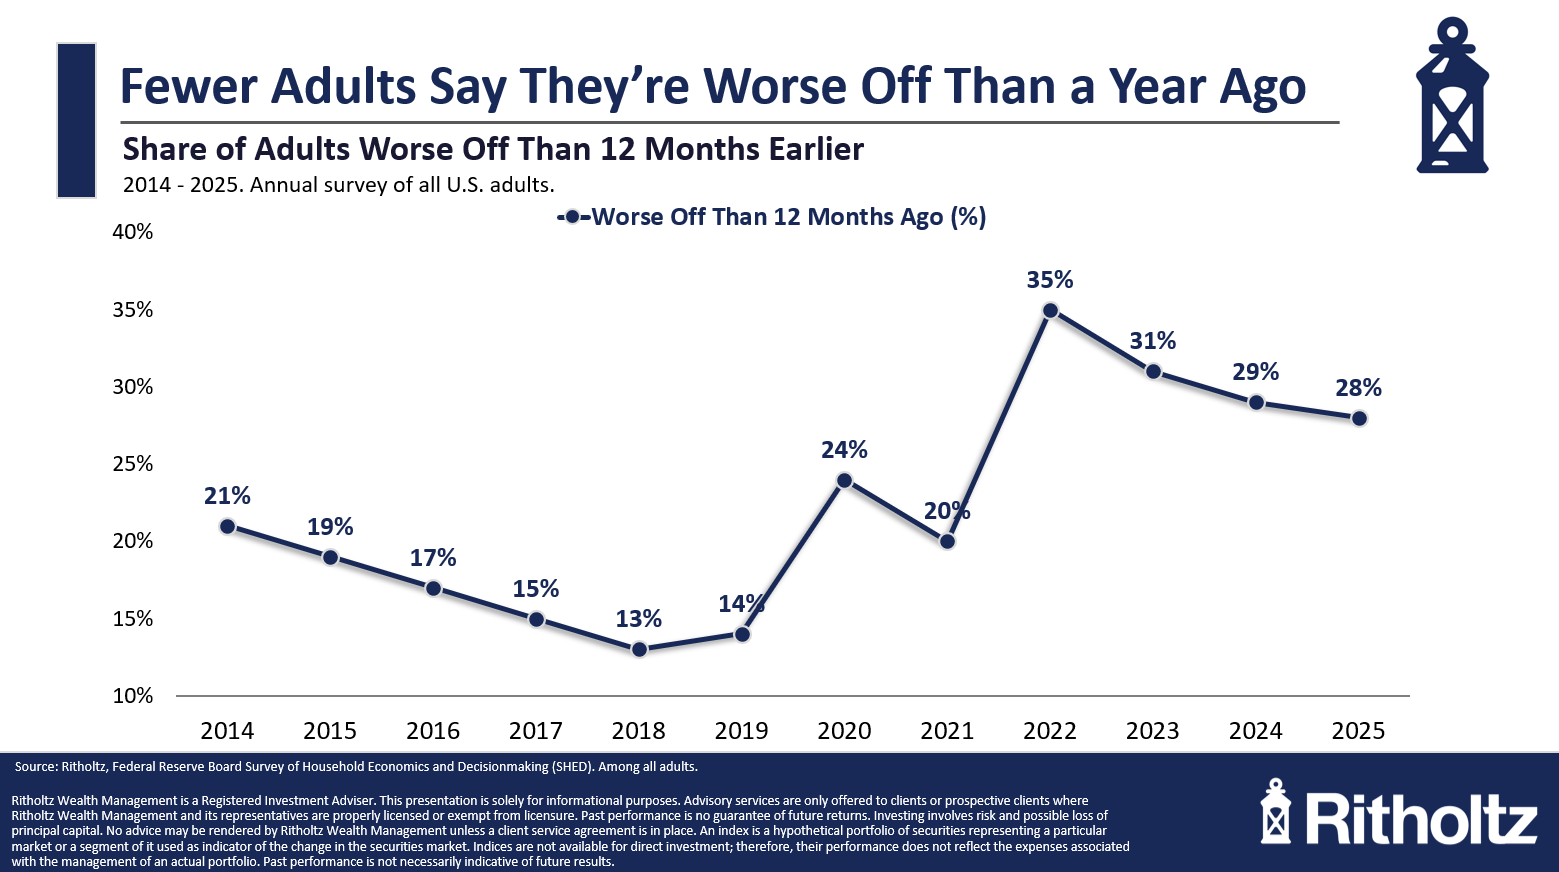
There are still a number of households who say they are doing worse off. These numbers have increased a decent amount in the 2020s.
The most interesting finding in the Fed’s data about how people feel about things is when you compare the household responses to how they feel about their local economy and the national economy:
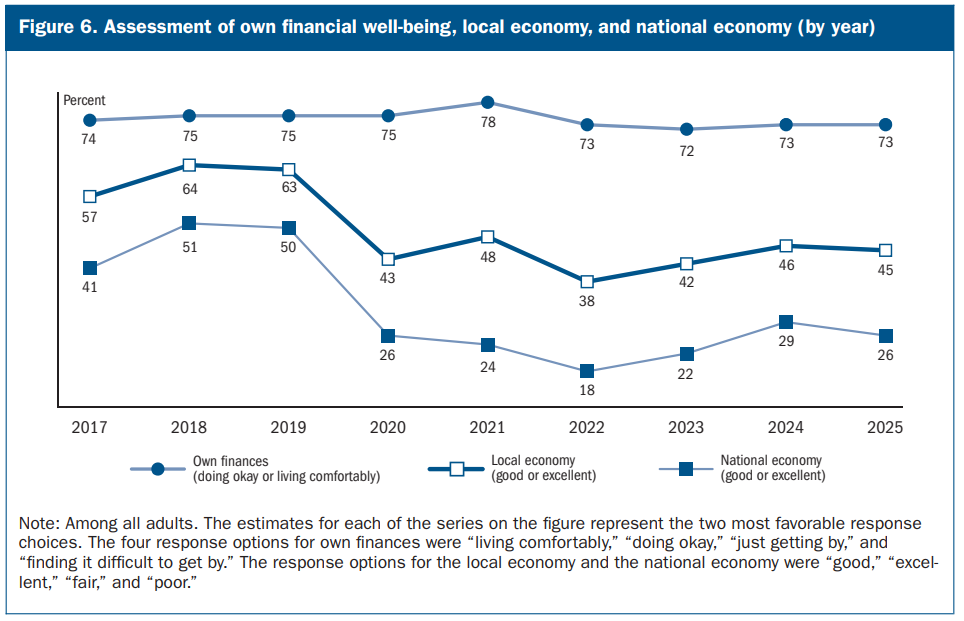
It’s an interesting dichotomy.
I’m fine. Everything else and everyone else is doing way worse than me.
I’m beginning to suspect all the negativity people see on the news and social media is affecting how they view the world.
Here’s my $400 expense question: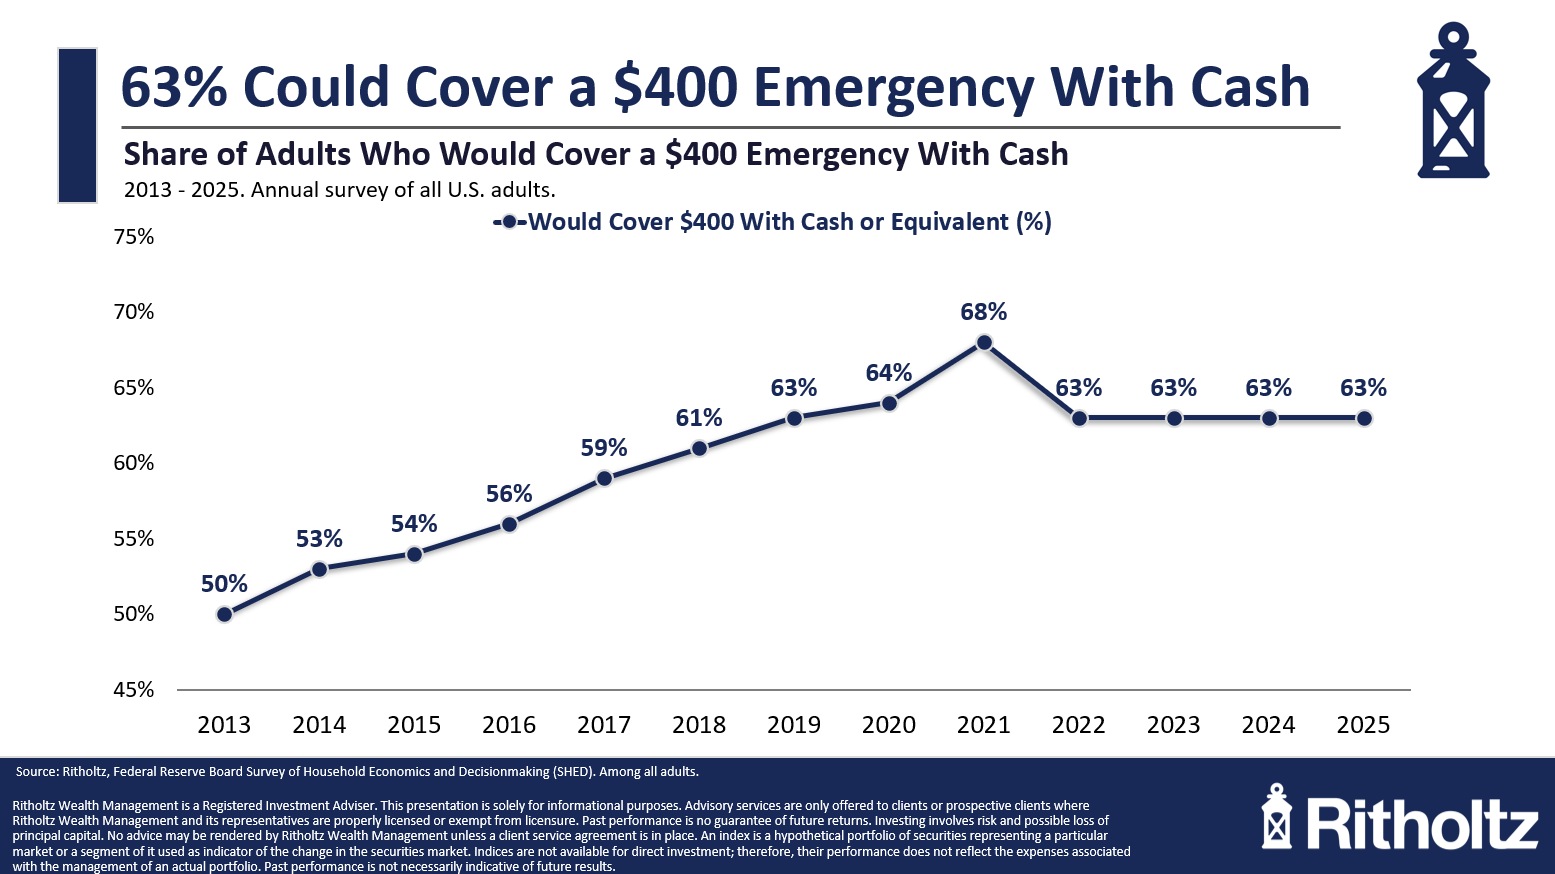
Everyone else said they would use a credit card, borrow the money or sell something. Why is it always $400? I have no idea.
Here’s another datapoint that’s better than I would have expected: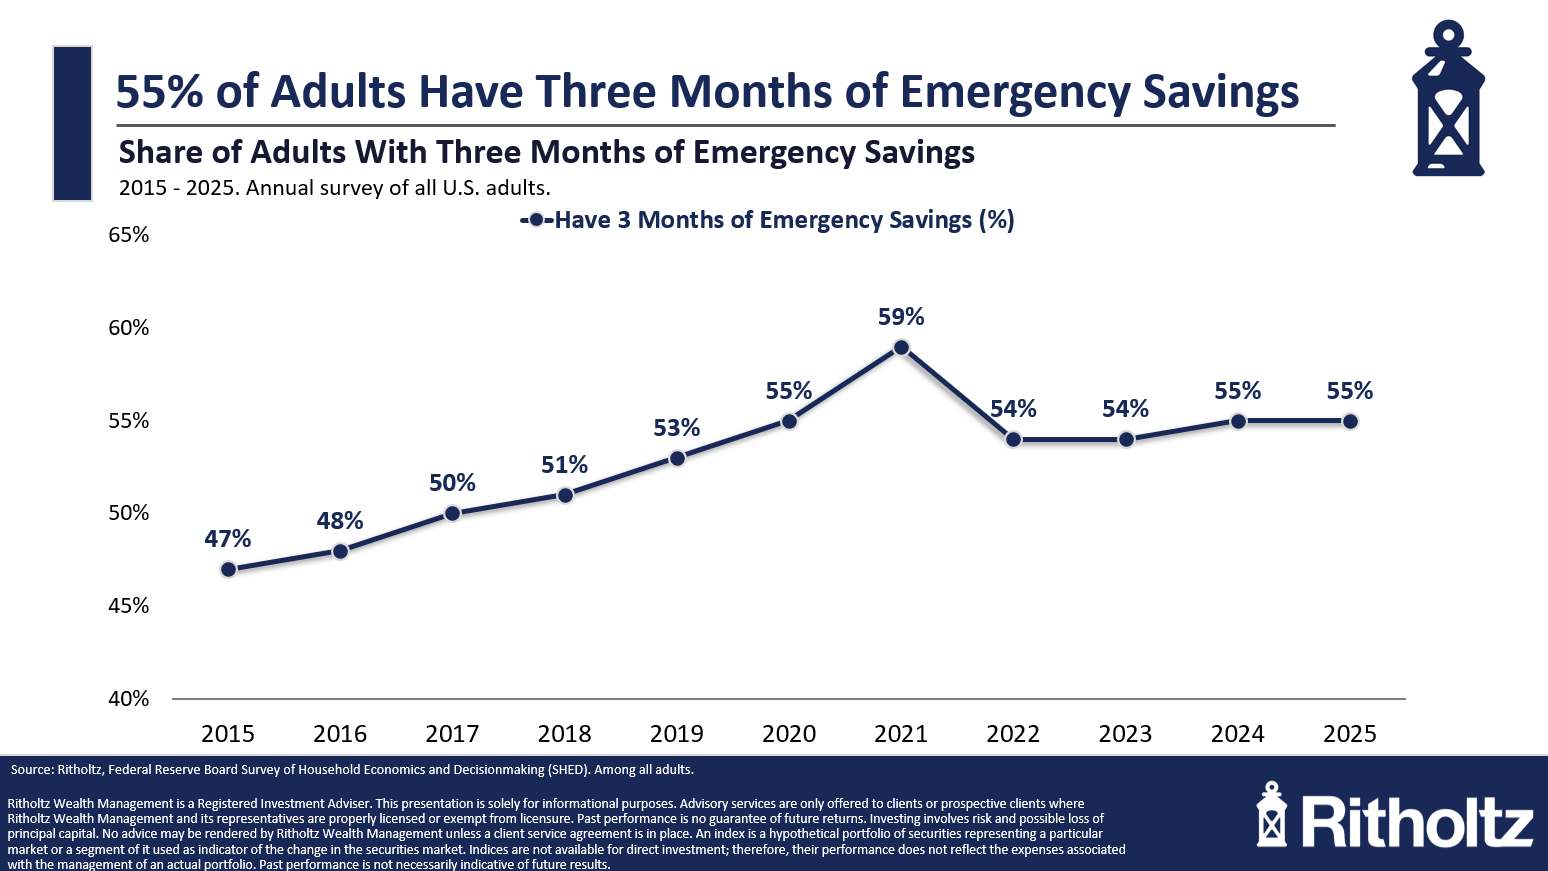
More than half of all households say they have at least three months of emergency savings.
This is way higher than I would have thought!
A good summary here would be that household finances are trending in the right direction for most people but not all people.
The economic data could always be better. There are, of course, many people who are struggling because of inflation or the fact that they don’t own financial assets or job loss or some other reason.
The economy is far from perfect.
But things are trending in the right direction for now.
That’s good news.
It won’t always be this way.
Further Reading:
The Rich Are Getting Richer. So is Everyone Else
1Just so we’re all on the same page here — all of these charts are adjusted for inflation.



0 Comments