


Following the U.S. midterm elections, U.S. tech stocks experienced a sharp sell-off, especially after investors grew increasingly anxious over the political and economic landscape and questioned whether heavy capital flow into AI infrastructure could generate returns in the near term.
The Nasdaq dropped 5.5%, marking its biggest one-day loss in 18 months and making investors more cautious. This sell-off also affected the crypto market, with Solana [SOL] falling 6.86% to $89.63 in the last 24 hours.
What made the decline worse were concerns within the Solana ecosystem. Notably, lending protocol Loopscale stopped operations after a security issue, while an upcoming validator upgrade deadline created more uncertainty for the network.
At the same time, over $11 million in long SOL positions were liquidated in an hour, thus increasing the selling pressure.
Solana’s daily chart signals continued bearish pressure
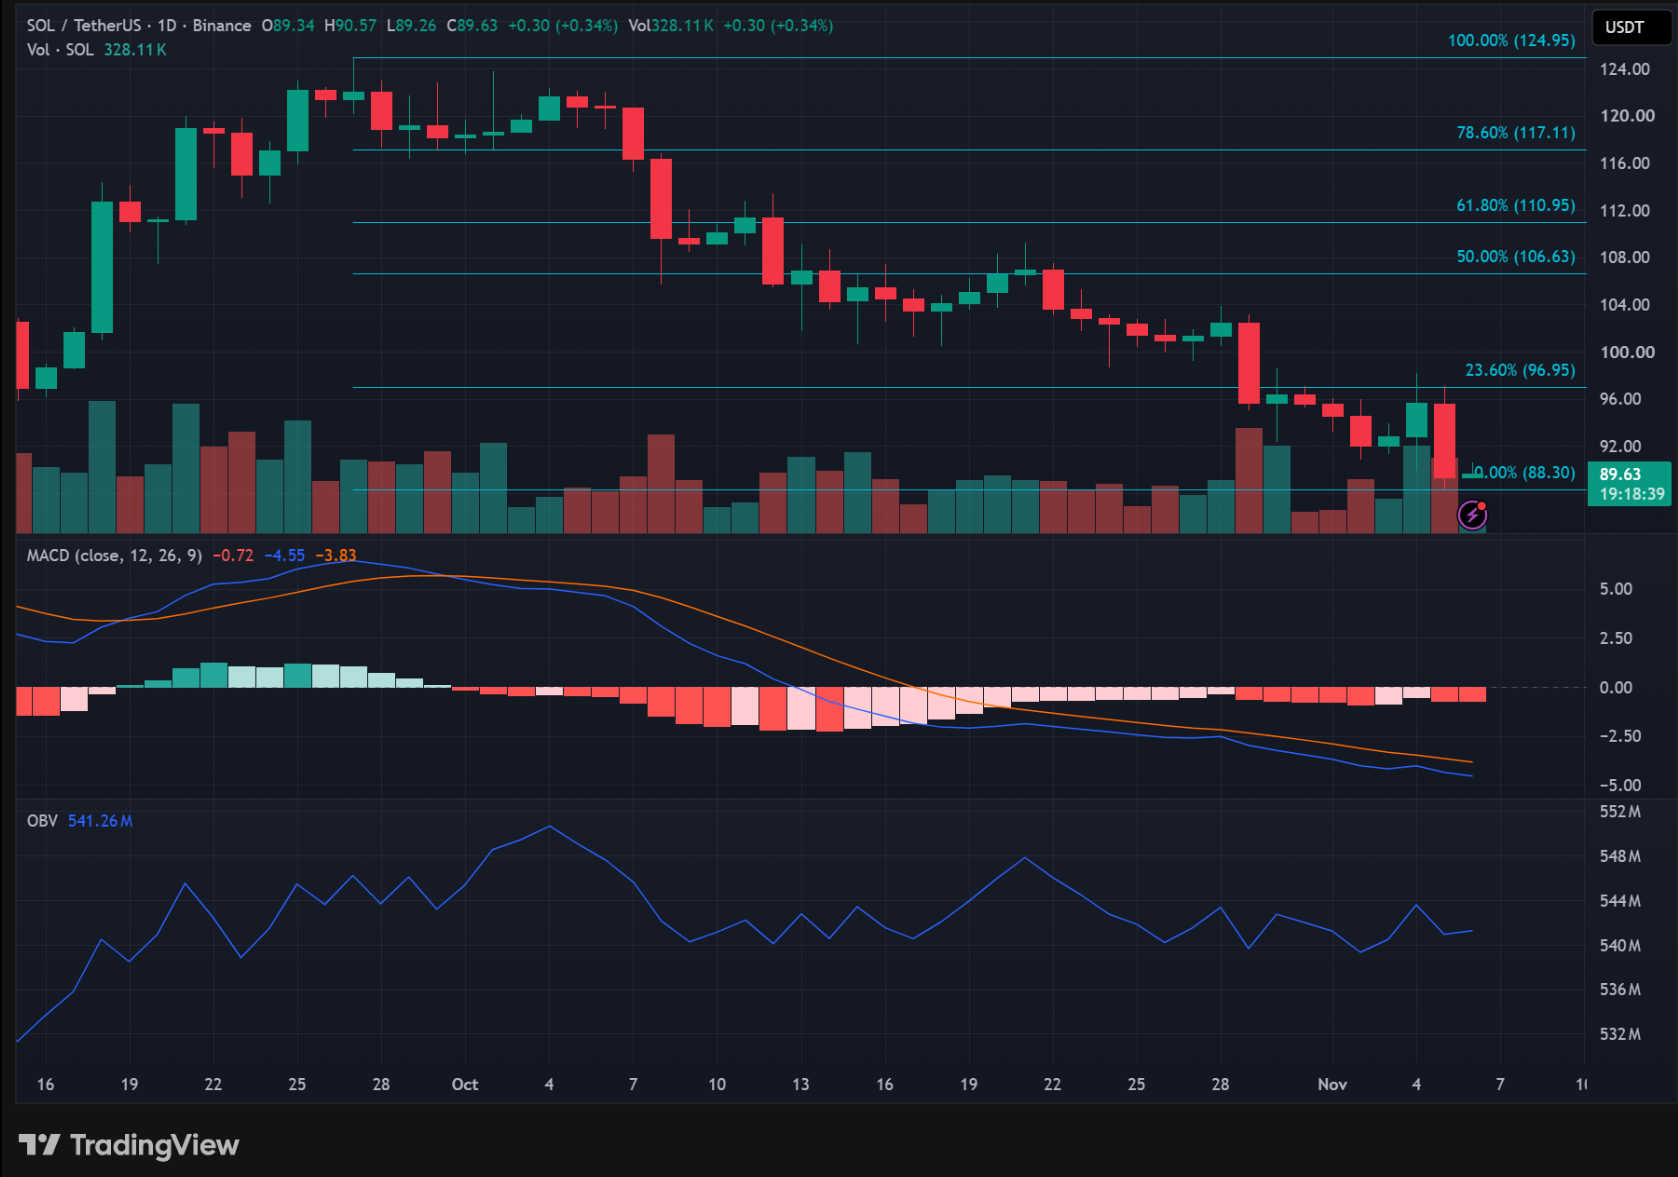
At the time of writing, SOL was trading at $89.63, within the 23.6% Fibonacci level on the daily chart. This recent decline brought the token under serious pressure and close to its swing low of $88.48.
Momentum indicators were also in line with the bearish view. The MACD was clearly showing that the downward momentum was still very much intact and that the sellers were still in complete control of the broader price action.
That made it very difficult for the buyers to get any kind of sustained recovery.
However, the daily OBV showed a slight uptick following its sharp decline during the latest sell-off. While this could suggest that buying activity was beginning to return, the relatively flat movement offered little confirmation of anything meaningful.
For now, it suggested that buyers are fighting hard to defend the $88 level.
Is Solana entering a consolidation period?
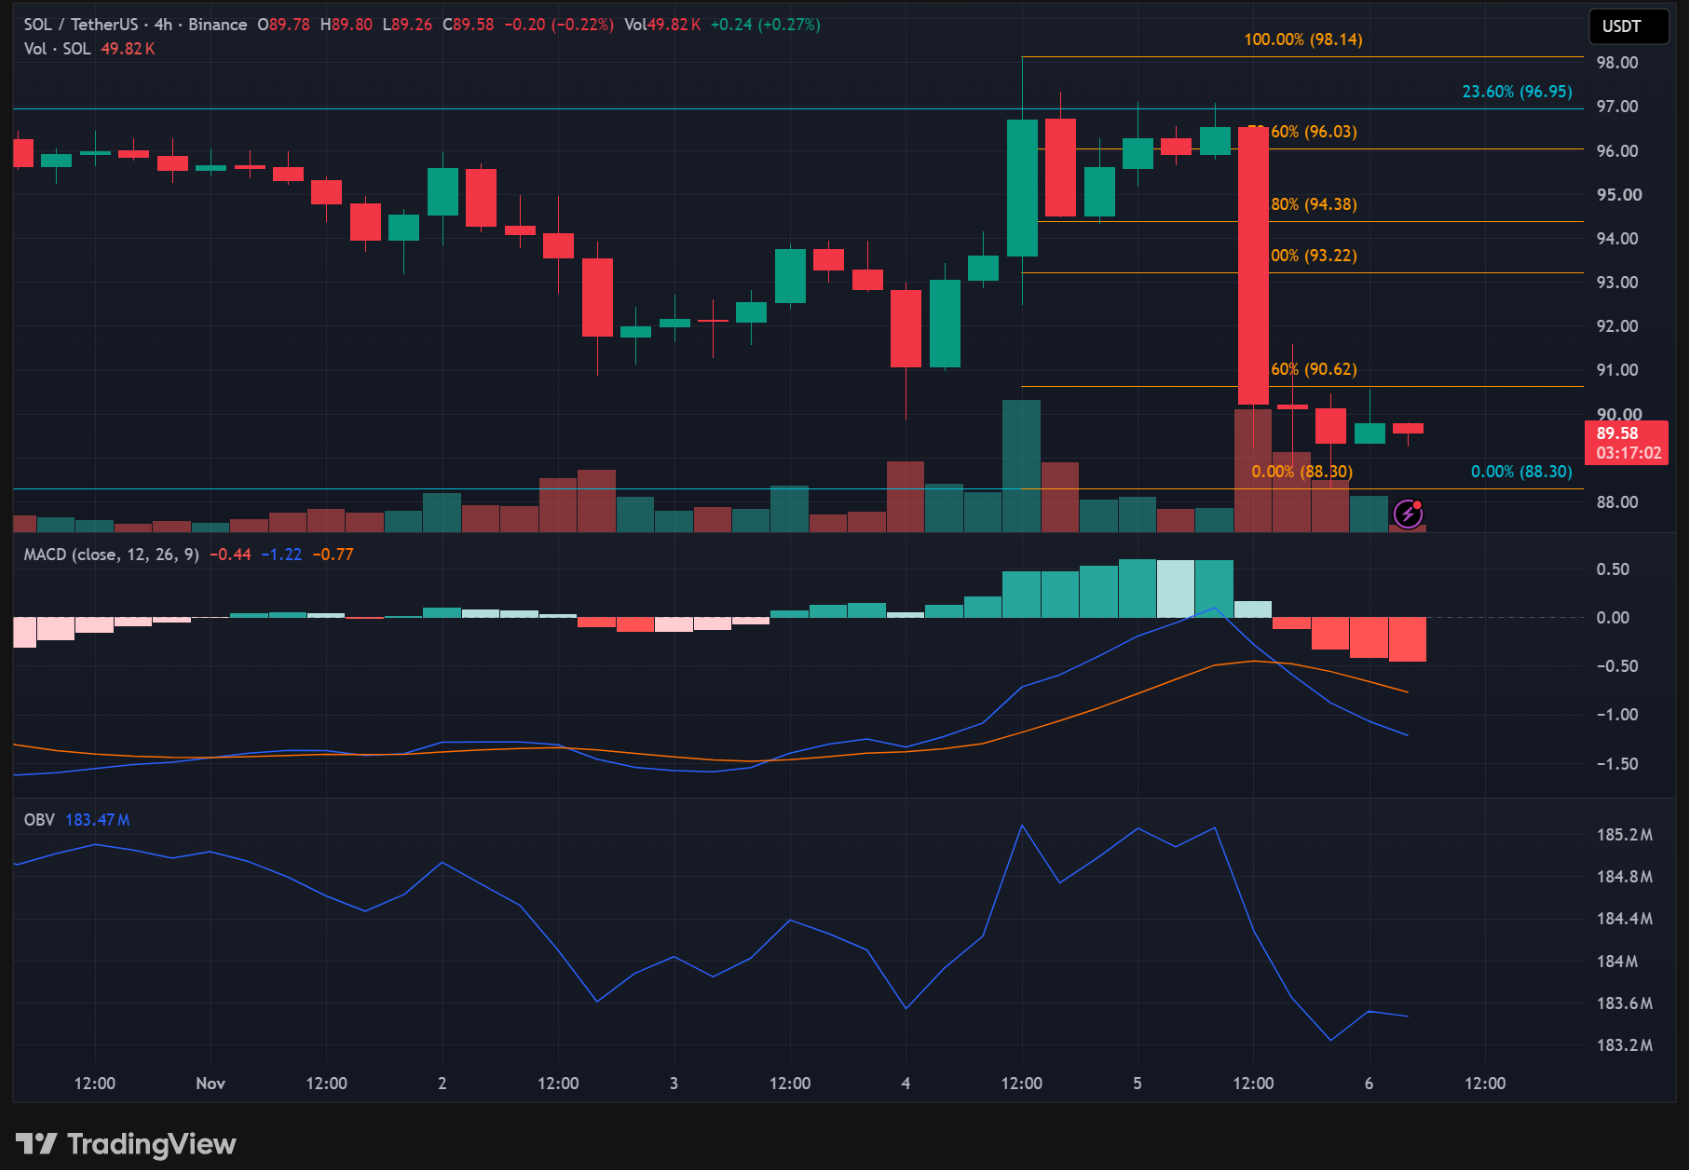
AMBCrypto’s look at Solana’s 4-hour chart painted a clearer picture of the altcoin’s immediate price action. Notably, after declining into the 23.6% Fibonacci region, SOL began consolidating instead of extending its losses.
This suggested that even though buyers were attempting to defend the current price region, a convincing recovery remained elusive.
The MACD continued to highlight the token’s bearish momentum, indicating that the broader selling pressure had still not subsided entirely. OBV also trended downward, suggesting that selling activity continued to outweigh buying pressure on the shorter timeframe.
Both the daily and H4 suggested that SOL’s current consolidation would persist in the near term before a bullish reversal can start to form.
Furthermore, the $88.48 swing low is an important level to watch. If SOL manages to defend this region, it could continue consolidating or attempt a relief bounce. However, if lost, it would expose the token to further losses, with $85 being the next potential downside target.
Final Summary
- Solana’s decline followed a broader risk-off move across financial markets, with weakness in U.S. technology stocks adding to selling pressure across crypto.
- SOL’s daily and H4 charts continued to show bearish momentum, although the shorter-term consolidation could offer some relief if buyers defend the $88.48 region.



0 Comments